
Two years ago, most marketing teams measured performance by staring at platform dashboards. Google said your ROAS was 5x. Meta said it was 8x. Your CFO said revenue was flat. Each number was “correct” inside its own system. Taken together, they didn’t make sense. Every dashboard told a different story, and no one knew which one to trust.
Now that confusion has turned into a real measurement problem.
Cookies are disappearing. Privacy rules are tighter (GDPR enforcement in Europe, state-level laws in the US, LGPD audits in Brazil). Ad blockers are everywhere. Click-level tracking – the backbone of last-touch attribution – covers less and less of the customer journey.
For marketing leaders, this changes the rules. So what are strong teams doing differently?
They use triangulation – combining three layers of measurement, where each one covers the others’ blind spots:
- Platform analytics and first-party tracking: for fast feedback and in-channel campaign optimization.
- Controlled experiments (incrementality tests): to understand real causal impact across channels.
- Marketing mix modeling (top-down modeling): to guide budget allocation and long-term investment decisions.
This guide explains:
- Which KPIs matter
- How to structure them into a clear hierarchy
- What to track by channel
- How to build a data setup you can trust
By the end, you’ll have a practical key performance indicators (KPI) framework, a channel-level performance playbook, and a 90-day plan to upgrade how you measure marketing effectiveness.
Build a Marketing Metrics Hierarchy That Maps to Business Outcomes
Before you choose tools or run experiments, step back and answer a simpler question:
What exactly are you measuring – and why?
The most common mistake in marketing measurement is optimizing the wrong metrics. Teams chase numbers that look impressive in a dashboard but have no real link to business results.
Here’s what that looks like.
A paid social manager reports a 4x ROAS on Meta. The dashboard looks strong.
At the same time, overall MER (Marketing Efficiency Ratio – total revenue divided by total spend) drops 15% quarter over quarter.
So what happened?
Attribution shifted more credit to paid ads and less to organic and direct. Paid performance appeared to improve. The business didn’t. Revenue growth slowed, even though the campaign “won” on paper.
This is how dashboards create false confidence.
To avoid this, you should align metrics to a clear business objective. That requires a strict KPI hierarchy that links board-level goals to channel metrics and daily campaign decisions.
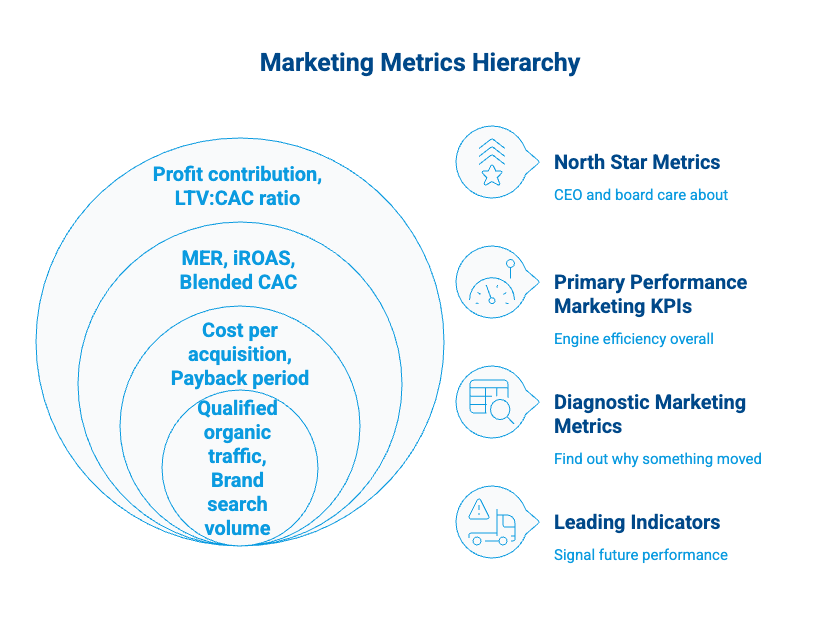
Tier 1: North Star Metrics
At the top of the hierarchy are the numbers your CEO and board care about. They answer one question: “Is our marketing investment making the business more valuable?”
- Profit contribution (not just revenue – margin matters for sustainable revenue generation)
- Customer lifetime value (LTV) to customer acquisition cost (CAC) ratio – often written as LTV:CAC. This single metric captures both how much it costs to win new customers and how much those customers are worth over their customer lifetime
- For B2B: pipeline generated, closed-won revenue, sales qualified leads (SQLs), and sales cycle velocity
- Net revenue retention (especially for SaaS and subscription models)
Tier 2: Primary Performance Marketing KPIs
One level down, these key metrics tell you whether the business is efficient overall – before you start diagnosing individual channels:
- MER (total revenue / total spend) – the simplest, hardest-to-game marketing effectiveness metric. Sometimes called the efficiency ratio, it tells you how every marketing dollar is performing
- iROAS (incremental return on ad spend) – what you get from experiments, not from platform reports
- Blended customer acquisition cost CAC by customer segment
Tier 3: Diagnostic Marketing Metrics
When something in Tier 2 moves in the wrong direction, these are the levers you pull to find out why:
- Cost per acquisition by channel and segment
- Payback period on acquisition cost
- Conversion rates at each stage of the sales funnel – from website traffic to qualified leads to closed deals
- Average order value (AOV), click through rate, and churn rate
Tier 4: Leading Indicators
Finally, these marketing metrics give you an early warning system – they signal whether future performance will improve or deteriorate before the revenue numbers confirm it:
- Qualified organic website traffic from your target audience
- Brand search volume trends (a proxy for efforts to increase brand awareness)
- Product-qualified leads (PQLs) and other signals that potential customers are engaging with your service/product
- Engaged sessions, return visit rate, and social media engagement from your relevant audience
Here’s the key insight across all tiers:
Channel-level ROAS can stay flat while overall MER declines.
If you only monitor platform dashboards, everything can look stable, while total efficiency drops in the background. You don’t see the problem until it appears in revenue.
Teams that start at the top of the hierarchy – business outcomes first – and then drill down into channels spot issues much earlier. Teams that start with channel metrics and work upward often react too late.
Knowing what to measure is the first step. But even the best KPI hierarchy is useless if the data feeding it is broken. That brings us to foundations.
Measurement Foundations: Instrumentation That Survives Signal Loss
No model or experiment will save you if the underlying data is garbage. Before investing in marketing mix modeling or incrementality tests, your team needs to get four foundations right. Think of this as the infrastructure layer that makes every other marketing measurement approach trustworthy. If you skip this step, your entire measurement setup becomes fragile.
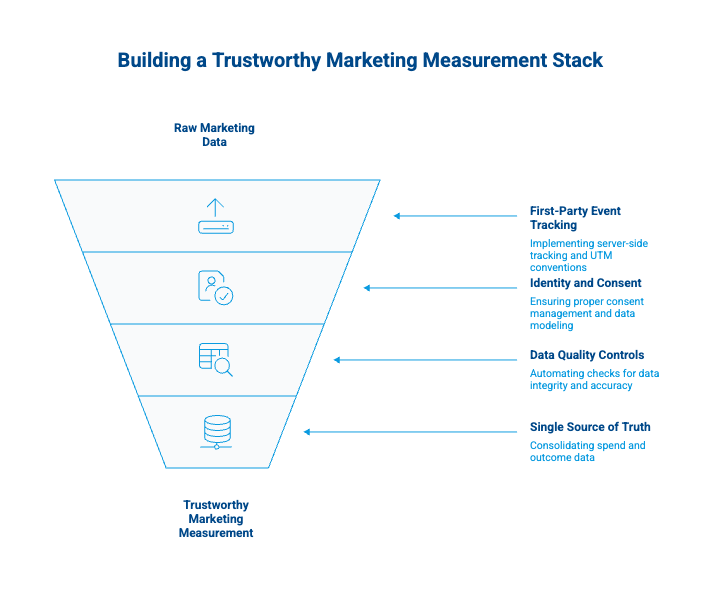
1. First-Party Event Tracking
Move to server-side tracking wherever possible. Client-side tracking through browser pixels is increasingly blocked or degraded by privacy tools. Set up a consistent event taxonomy across all platforms and enforce strict UTM conventions. A UTM without a standardized naming convention is barely better than no UTM at all – and it will corrupt your analytics downstream.
2. Identity and Consent
Implement consent-modeled analytics. Google Analytics 4 already fills gaps in conversion data using modeling for users who decline cookies. Make sure your consent management platform is configured properly and that you’re not accidentally excluding 30–40% of your website traffic from measurement. Without this step, your data sources will dramatically undercount the impact of your digital marketing efforts.
3. Data Quality Controls
Automate checks for missing UTMs, sudden conversion drops, and channel mapping drift. A weekly data quality report takes two hours to set up and prevents months of bad decisions based on broken analytics. Set up alerts for tracking breakages across all data source – especially after platform updates or tag manager changes.
4. A Single Source of Truth for Spend and Outcomes
Consolidate all media costs (including agency fees, tool subscriptions, and creative production) into one dataset. Digital marketing agencies often report costs in different formats, so normalization is essential. Then connect that spend data to actual revenue outcomes – not just conversions in Google Ads, but pipeline and revenue in your CRM.
This last point is where most teams hit a wall. Google Analytics knows where your traffic came from. Your CRM knows which deals closed and for how much. But the two systems don’t talk to each other natively – and without that connection, you can’t trace campaign performance to actual revenue generation.
Tools like GA Connector close this loop by automatically pushing traffic-source data into your CRM (Salesforce, HubSpot, Pipedrive, or Zoho), so every lead and deal carries its origin from first touch to closed revenue. It’s a lightweight, affordable integration that takes minutes to set up – and it’s the foundation layer that makes the rest of your measurement stack trustworthy. If you want to work with existing marketing data in your CRM and enrich it with source information, this is the simplest path.
With clean data and a single source of truth in place, you’re ready to answer the hardest question in marketing: did this actually cause the outcome, or just correlate with it?
Incrementality Testing: The “Point of Truth” of Marketing Performance Measurement
Platform analytics tell you what correlated with a conversion. Incrementality testing tells you what caused it. That’s the difference between “users who saw this ad also bought” and “this campaign created purchases that would not have happened otherwise.”
According to IAB guidelines for commerce media campaign measurement, incrementality is the standard for proving causal impact of marketing activities. Here are four approaches, ranked from simplest to most sophisticated.
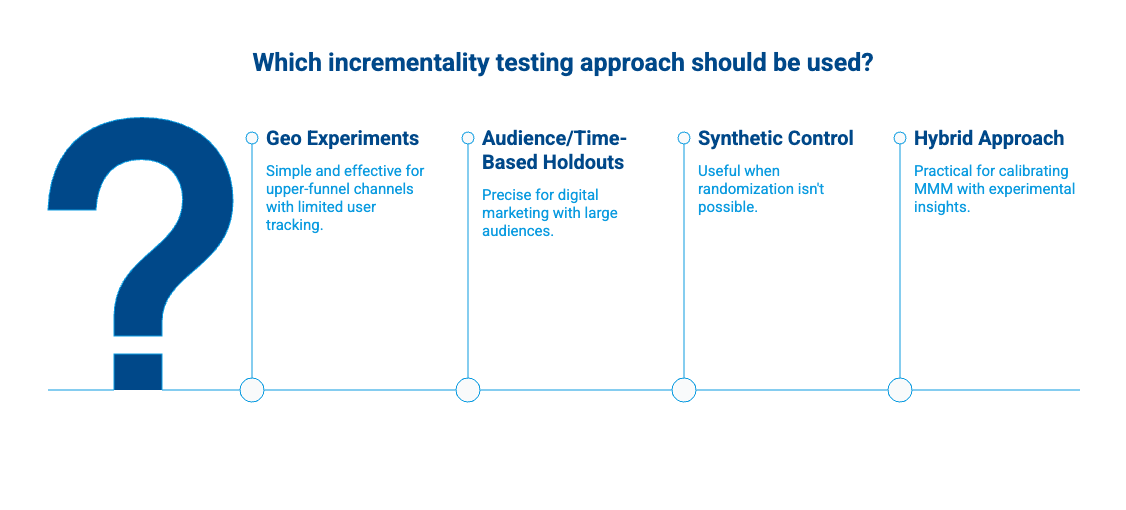
Geo Experiments
The most straightforward approach: split regions into test (ads on) and control (ads off), then compare outcomes. This works well for upper-funnel channels like CTV, out-of-home, and retail media where user-level tracking is limited. The catch is that you need enough geographic diversity in your target audience to get statistically meaningful results.
Audience/Time-Based Holdouts
A step up in precision. Randomly hold back a percentage of your relevant audience from seeing paid ads on always-on channels (paid social retargeting, display, email campaigns). Compare the holdout group’s behavior to the exposed group. This is the cleanest method when you have large enough target audiences to measure digital marketing performance accurately.
Synthetic Control / Model-Based Counterfactuals
When strict randomization isn’t possible – say you can’t turn off a channel in a clean geographic segment – use statistical models to construct a “what would have happened” baseline. Less rigorous than true holdouts, but useful for channels where you can’t easily turn off ad spend in clean segments.
Hybrid: Experiments Feeding MMM Calibration
The most practical approach for most organizations: run small-scale experiments to generate insights and ground truth, then use those results to calibrate your MMM (covered in the next section). This gives you causal proof without needing to run experiments on every channel simultaneously.
Whichever approach you choose, standardize the readout. Every incrementality test should report:
- Incremental lift (conversions or revenue the marketing campaign actually created)
- Cost per incremental outcome (iCPA or iROAS – the true cost per conversion, not the platform-reported one)
- Confidence interval (how certain you are)
- Guardrail metrics (brand health, margin, churn – to make sure the lift from your marketing efforts didn’t come at a hidden cost)
Run these tests quarterly at minimum. The results change as markets, target audiences, and competitive dynamics shift. These experiments generate insights that no amount of dashboard-watching can replicate.
Incrementality tests give you causal proof for individual channels. But how do you decide where to shift your next dollar across all of them? That’s where marketing mix modeling comes in.
Marketing Mix Modeling Is Back (and More Accessible Than Ever)
Marketing mix modeling (MMM) fell out of fashion in the 2010s when granular, user-level tracking made it seem unnecessary. Now that user-level data is fragmenting, MMM has returned as a core pillar of marketing measurement – because it only needs aggregate data and is completely privacy-durable.
What’s changed is accessibility. Two open-source tools have made MMM available to organizations without a dedicated data science department:
Google Meridian, released broadly in 2025, provides a Bayesian MMM framework with built-in tools for incorporating prior knowledge and experiment results. It integrates naturally with Google Analytics data and is designed to work alongside Google’s digital advertising ecosystem, but can model any channel.
Meta Robyn, originally R-based and now with a Python beta, uses automated hyperparameter tuning and budget optimization. It’s been in production at Meta for several years and has a strong open-source community. Both tools accept multiple data sources and can model social media, digital advertising, content marketing, and offline channels together.
How Strong Teams Use MMM
MMM gives you direction and magnitude: “Spend more on YouTube, less on display” and “the marginal return on paid search is declining past $X/month.” It’s excellent for setting budget ranges and identifying diminishing returns across your marketing strategies.
But know its limits. MMM is not designed for daily bid decisions or creative optimization. Those require faster feedback loops from platform marketing analytics and real-time campaign performance data.
What to Measure by Channel Type
Here’s a practical channel-by-channel reference for tracking marketing performance across your entire portfolio of marketing activities. Use it to track performance marketing results and decide which measurement approach fits each channel.

Performance Marketing Channels (Paid Search, Paid Social, Affiliates)
These are your bread-and-butter direct-response channels. They need three layers of measurement:
- Operational control: platform-reported conversions, cost per acquisition, ROAS (fast feedback, imperfect truth)
- Causal proof: incremental lift tests, especially on retargeting and branded search paid ads
- Marketing budget decisions: MMM marginal returns to find the point of diminishing returns on ad spend
A critical test to run early: a branded search holdout. Many performance marketing teams discover that 50–70% of branded search clicks would have converted anyway through organic or direct. The iROAS is often much lower than the platform reports.
Upper Funnel (Video, Creators, Sponsorships, CTV)
Upper-funnel campaigns rarely show strong last-click results, and that’s expected. Measure them by their influence on the entire marketing funnel, not just by direct conversions:
- Reach and frequency vs. saturation curves across target audience segments
- Brand search volume trends (a proxy for marketing efforts to increase brand awareness among potential customers)
- Geo lift tests for causal measurement
- MMM to capture halo effects on social media channels and other channels
Content Marketing and SEO
Content marketing and SEO are long-game strategies, so apply a 6–12 month measurement horizon instead of judging them weekly:
- Qualified organic traffic from your target audience (not all traffic – filter to sessions with high-intent signals)
- Cost per qualified session (total content investment / qualified sessions)
- Pipeline from organic (requires CRM integration – exactly the kind of loop GA Connector closes)
- Visibility in AI-driven discovery (LLM citations, AI Overview appearances, ChatGPT referrals)
The right metrics here are cost per lead CPL from organic, revenue per content piece, and share of search visibility vs. competitors.
CRM and Lifecycle (Email Campaigns, Push, In-App)
Lifecycle channels have their own measurement trap: open rates. If you’re measuring email campaigns by open rate in 2026, you’re tracking a metric that no longer means what it used to. Apple’s Mail Privacy Protection inflated open rates years ago, and the problem has only gotten worse. Instead, focus on:
- Incremental retention measured through holdout cohorts (send vs. don’t-send for email campaigns and social campaigns)
- Contribution margin impact (not open rates – actual revenue per cohort and customer lifetime value)
- Activation rates for onboarding sequences and new customer nurture flows
Focus on other metrics that reflect real marketing effectiveness: revenue per send, holdout-based incrementality, and cost per lead CPL for reactivation.
Retail and Commerce Media
Retail media is growing fast, but measurement is fragmented across networks. Treat each one separately:
- Incrementality per retailer network (Amazon, Walmart, Instacart – each needs separate testing and campaign measurement)
- SKU-level profitability (not just ROAS – account for margin differences between products to understand true marketing ROI)
- Cross-channel cannibalization checks (is your retail media stealing from your D2C? Examine channel performance across all data sources before scaling)
All of this might feel like a lot. The good news: you don’t have to build everything at once. Here’s how to phase it in over 90 days.
The 90-Day Marketing Measurement Upgrade Plan
This plan works whether you’re in a startup, a mid-market company, or partnering with a digital marketing agency. The goal is to move from dashboard-watching to real marketing performance measurement in three focused sprints.
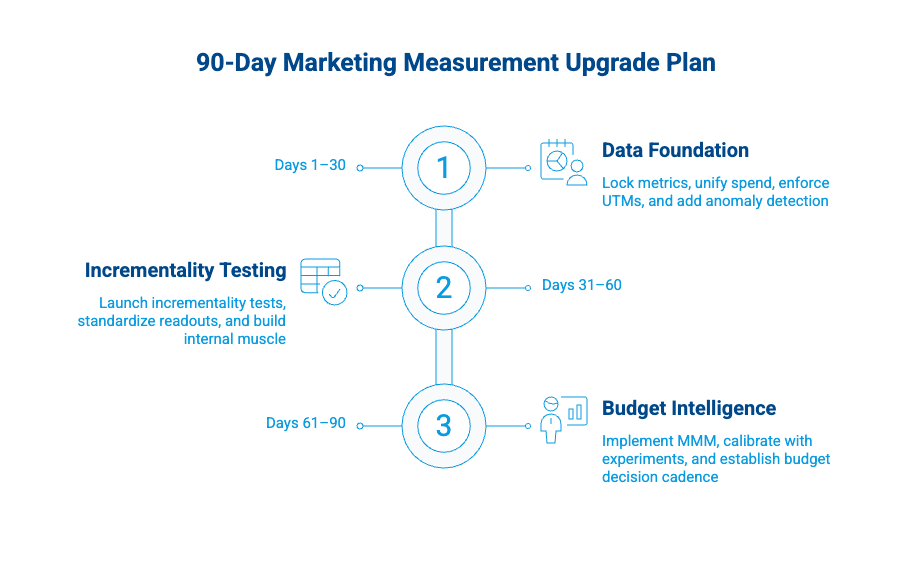
Days 1–30: Make the Data Usable
Before you can measure anything with confidence, you need clean inputs. These four moves create the foundation:
- Lock your marketing metrics hierarchy and definitions in one document. Version it. Share it with every stakeholder across your teams. This eliminates the “but that’s not how I define CAC” conversations and ensures everyone is working toward the same business objectives.
- Unify spend and outcomes into one dataset. All media costs, all agency fees, all tool costs – mapped to the same time periods and channel groupings. Pull existing marketing data from all your marketing platforms into a single view.
- Enforce UTM conventions and channel grouping rules. Audit existing UTMs across all campaigns, social media posts, and paid ads. Fix the broken ones, and set up automated alerts for non-compliant URLs.
- Add anomaly detection for your key metrics. Set up automated alerts for sudden drops in conversions, spikes in cost per lead CPL, cost per acquisition, or tracking breakages. A simple threshold-based system in Google Sheets or Google Analytics works.
One of the fastest wins in this phase is connecting your web analytics to your CRM. GA Connector integrates with Salesforce, HubSpot, Pipedrive, and Zoho in minutes, so you can start seeing which channels actually drive revenue – not just leads – within your first week. It’s an affordable quick win that pays for itself almost immediately.
Days 31–60: Add Causal Proof to Your Marketing Strategies
With clean data in place, you can start running the experiments that separate correlation from causation:
- Launch one or two incrementality tests. Start with your highest-spend channel or the one where you suspect the biggest gap between platform-reported and actual performance. Social media channels and branded search on social media are common starting points.
- Standardize the test readout template. Every test should report lift, iCPA/iROAS, confidence interval, and guardrail metrics. Use the same format every time so results are comparable across marketing campaigns.
- Build internal muscle. Present results to marketing leaders and the broader revenue org. Frame them as “here’s what we proved about our marketing efforts, here’s what we’ll test next.” This builds credibility and buy-in for the next phase.
Days 61–90: Add Budget Intelligence
Now you’re ready to layer on the modeling that turns data into allocation decisions:
- Implement MMM. Start with Google Meridian or Meta Robyn. Feed in 2–3 years of weekly spend and outcome data by channel. If you only have 1 year of data, start with Robyn – it handles shorter time series better. Pull data from Google Analytics, your ad platforms, and CRM for the most complete picture.
- Calibrate with experiment results. Plug your incrementality findings into the model as Bayesian priors (Meridian) or calibration constraints (Robyn). This step is what separates valuable insights from a spreadsheet horoscope.
- Create a budget decision cadence. Monthly: review MMM outputs, channel performance, and experiment results. Quarterly: reallocate budget based on marginal returns and confidence levels.
Once you’re running this system, you’ll need to communicate what it’s finding. And that means rethinking how you report.
The Board-Ready Marketing Performance Report
Executive stakeholders aren’t looking for more charts. They want clarity – ideally on a single page – and answers to three simple questions:
- Is marketing driving real business results?
- Where should we put more budget?
- What could hurt performance next?
Structure your report around five components:
- Overall MER / contribution margin trend. One chart showing marketing effectiveness over time. If the line goes up, your strategies are working. If it’s flat or declining, explain why and what you’re doing about it.
- Incrementality scoreboard. A table showing which channels and campaigns created measurable lift this quarter, with confidence levels. This replaces the old “channel ROAS” table and carries much more credibility. Include cost per incremental conversion alongside revenue lift.
- Budget reallocation recommendations. Based on MMM marginal returns and experiment results. Frame recommendations as ranges, not point estimates: “Increase YouTube ad spend by 15–25% and redirect from display.” Sales metrics and pipeline data should support every recommendation.
- Risks and watch items. Tracking changes, data gaps, saturation in key channels, rising cost per acquisition, competitive moves. Proactively surfacing risks builds trust faster than hiding them. Note any social media platform changes or digital advertising policy updates that could affect measurement.
- Next experiments. What initiatives you’ll test next quarter and why. This shows forward momentum and keeps leadership engaged in the marketing measurement program and reinforces that marketing measurement is a continuous practice, not a one-time project.
Keep it to two pages maximum. If you can’t explain your marketing performance in two pages, you don’t understand it well enough yet.
Measurement Maturity Is a Competitive Advantage
The teams that will win in 2026 won’t just have bigger budgets. They’ll know – with evidence – what each dollar of spend actually generates in revenue and new customers.
The triangulation approach isn’t theory. Many performance teams already combine:
- Platform analytics and reporting
- Incrementality experiments
- Marketing mix modeling
They use different tools. Some rely on open-source models. Others use affordable integrations. Technology isn’t the main barrier.
The real barrier is organizational mindset – moving away from vanity metrics and toward causal proof of marketing ROI.
Start with what you control:
- Clean, reliable data
- A clear KPI hierarchy tied to business outcomes
- One incrementality test on your highest-spend campaign
Choose the campaign where you suspect the biggest measurement gap. Run the test. Share the results. Build internal confidence.
Add marketing mix modeling.
The 90-day plan outlined above works whether you’re a solo marketer, part of an agency, or leading a 50-person team.
If you make one move today, make it this: Connect your marketing data to revenue.
If you can’t trace a lead from first click to closed deal, you’re making decisions in the dark – no matter how advanced your attribution setup looks.
Ready to close the loop between marketing spend and actual revenue? Start a free GA Connector trial and see which campaigns drive real pipeline – not just clicks.

Sergii Zuiev is the founder of GA Connector, a marketing attribution platform helping sales and marketing teams track revenue back to the channel, campaign, and keyword level. With a background in PPC and marketing technology, he built GA Connector in 2015 after experiencing firsthand the frustration of not knowing which ads actually drove revenue, and turned that insight into a product now used by hundreds of companies globally.

