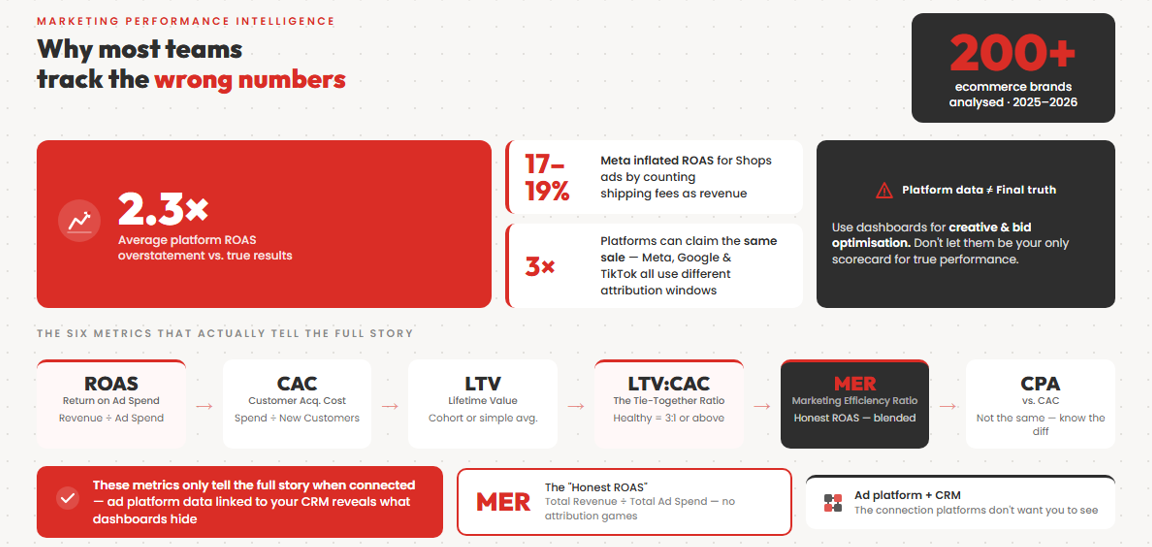
If you want to measure marketing performance in 2026, the six metrics that matter most are ROAS, CAC, LTV, LTV:CAC, MER, and CPA vs. CAC. Together, they show revenue efficiency, real acquisition cost, customer value, and whether your channel dashboards match business reality. On their own, each metric can mislead you. Connected together, they actually tell the truth.
Why do most marketing teams track the wrong numbers?
Most teams rely on platform dashboards that are built to flatter. The numbers look clean. The story they tell is not always real.
Why does “good performance” look better in-platform than in real life?
Because platforms grade their own homework. Meta, Google, and TikTok all want credit for the same sale. They use different attribution windows, view-through logic, and modeled conversions. That makes platform-reported ROAS inflation a very real problem.
According to research, marketing platforms overstate true ROAS by an average of 2.3x, based on analysis of more than 200 ecommerce brands in 2025 and 2026. That is not a rounding error. That is the difference between “scale this now” and “why is cash getting weird?”
There are also smaller, sneakier issues. Meta inflated ROAS for Shops ads by counting shipping fees as revenue. That boosted reported results by 17% to 19%. If your margin is already tight, that kind of inflation can make a mediocre campaign look like a hero.
This does not mean platform data is useless. It means it is for optimization, not final truth. Use it to compare creatives, audiences, and bids. Do not use it as your only scorecard for true performance measurement.
Why do these six metrics fit together?
Each metric answers a different question. ROAS asks whether ad spend drove revenue. CAC asks what it really cost to get a customer. LTV asks what that customer is worth after the first purchase.
Then LTV:CAC ties cost to value. MER marketing efficiency ratio gives you the blended, top-level reality check. CPA vs. CAC clears up whether you are paying for a lead, a signup, or an actual customer.
This matters because better attribution changes outcomes. Companies using attribution effectively see 15% to 30% higher marketing ROI. The same research says proper attribution can reduce wasted ad spend by 27%. One metric catches the lie the other metric tells.
What is ROAS and how do you calculate it?
ROAS measures how much revenue your ads generate per dollar spent. It is the first number most teams look at — and the one most likely to mislead them if they stop there.
What is the ROAS formula?
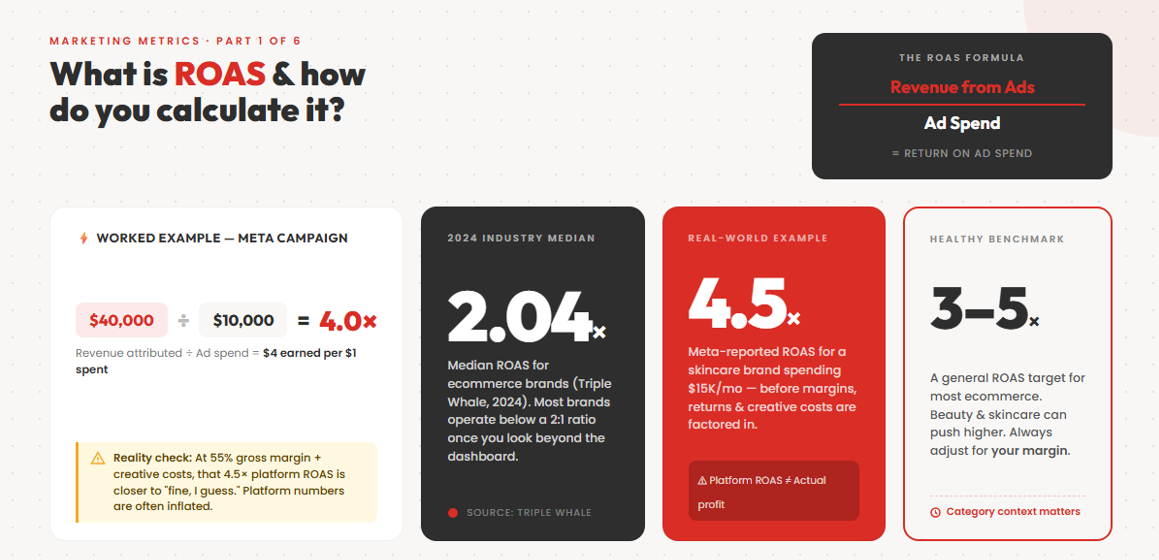
ROAS stands for Return on Ad Spend. The ROAS formula is:
ROAS = Revenue from ads / Ad spend
If you spend $10,000 on ads and generate $40,000 in attributed revenue, your ROAS is:
$40,000 / $10,000 = 4.0
That means you made $4 for every $1 spent on ads. Simple enough. The trouble starts when people assume that number equals profit.
What does a real ROAS example look like?
Say you run paid social for a skincare brand. You spend $15,000 on Meta in a month. Meta reports $67,500 in purchase revenue. Your in-platform ROAS is 4.5.
Looks great. Then reality shows up. Your gross margin is 55%. You paid $2,500 for creative. Returns were higher than usual. Suddenly that 4.5 starts looking more like “fine, I guess.”
This is why blended ROAS vs platform ROAS matters. According to Triple Whale, the median ROAS for brands on its platform is 2.04. Most ecommerce brands are operating below a 2:1 ratio once you look beyond the prettiest dashboard.
There is also category context. Beauty category social media ROAS jumped from $1.90 in Q4 2024 to $3.50 in Q1 2025. A “good” number moves fast by vertical and season. That is why copying someone else’s benchmark is lazy.
What is a good ROAS benchmark?
A return on ad spend benchmark depends on margin, repeat purchase rate, and how fast you get paid back. There is no universal magic number. Anyone saying “good ROAS is always 4x” is selling confidence, not accuracy.
For many ecommerce brands, 3x to 4x can be healthy — but only if margins support it. If your product has thin margin, even 4x might still stink. The median ROAS on Triple Whale was 2.04, which means a lot of brands calling themselves efficient are not exactly printing money.
Lead gen is different. Immediate ROAS can look weak while downstream revenue is strong. The average Google Ads conversion rate across industries in 2025 was 7.52%. That tells you clicks can convert. It tells you nothing about whether those conversions become good customers.
What mistake do most teams make with ROAS?
The biggest mistake is trusting platform-reported ROAS as truth. That is how teams scale spend while profit stays flat. The platform sees a conversion event. It does not see your full business.
The second mistake is ignoring attribution window mismatch. Meta may claim a sale on a 7-day click and 1-day view basis. Google may claim it on a different window. Your CRM may show the customer came through email. Everyone is technically “right,” which is exactly the problem.
The third mistake is using revenue when gross profit would tell a better story. Revenue is loud. Margin is honest. If your shipping, discounts, and returns are ugly, ROAS can flatter a bad business.
What is CAC and what does it really include?
CAC is the true cost of acquiring a paying customer. Most teams calculate it wrong because they only count ad spend and ignore everything else that makes acquisition happen.
What is the full CAC formula?
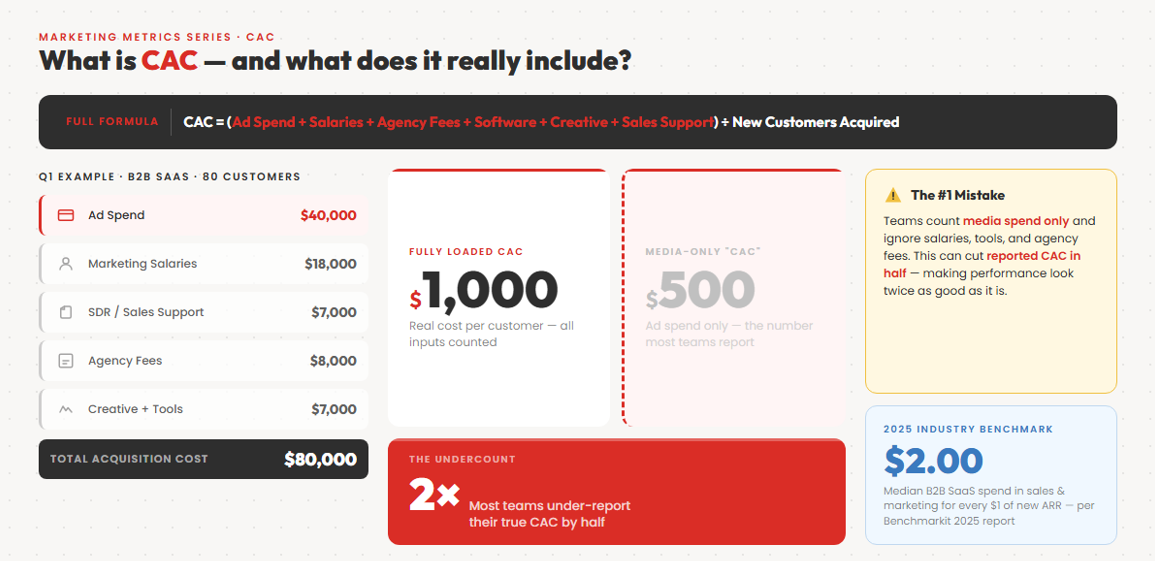
CAC stands for Customer Acquisition Cost. The basic formula is:
CAC = Total acquisition cost / Number of new customers acquired
The fully loaded CAC formula looks like this:
CAC = (Ad spend + salaries + agency fees + software + creative production + landing page tools + sales support costs) / New customers acquired
This is where most teams get sloppy. They count media spend and call it a day. That is not fully loaded CAC including salaries, tools, and agency fees. That is wishful thinking.
What does a full CAC example look like?
Say a B2B SaaS company acquires 80 new customers in a quarter. Costs break down like this: $40,000 in ad spend, $8,000 in agency fees, $18,000 in marketing salaries, $4,000 in creative, $3,000 in tools, and $7,000 in SDR support.
Total acquisition cost is $80,000. So CAC = $80,000 / 80 = $1,000.
If they only counted media spend, they would report $500 CAC. That is fantasy math. B2B SaaS companies spend a median of $2.00 in sales and marketing to acquire $1.00 of new customer ARR, up 14% year over year. If your CAC math feels suspiciously low, it probably is.
What is a healthy CAC benchmark?
There is no universal answer to what is a good CAC. A healthy number depends on what a customer is worth and how fast you recover the spend. A high CAC can be fine if retention is strong and payback is quick.
For ecommerce, there is at least a rough reference point. The average customer acquisition cost in ecommerce is around $70, though it varies by country and industry. That is a useful gut check, not a law of physics.
For SaaS and lead gen, the number can be much higher. If you need 18 months to recover CAC and cash is tight, you do not have a scaling problem. You have a survival problem.
What hidden costs do teams usually miss?
The biggest miss is people cost. If your marketer, designer, SDR, or lifecycle person helps acquire customers, some of that cost belongs in CAC. You cannot call labor “overhead” just because it makes the spreadsheet prettier.
The next miss is tools. Your CRM, attribution platform, landing page software, call tracking, enrichment tools, and reporting stack all support acquisition. Those are classic customer acquisition cost hidden costs. Agency retainers count too. So do freelancers. So does sales support for inbound follow-up. If it helps turn strangers into customers, it belongs in the number.
What is LTV and how should you calculate it?
LTV measures the total value a customer delivers over their relationship with your business. Get the inputs wrong and every downstream decision gets wrong with them.
What is the simple LTV formula?
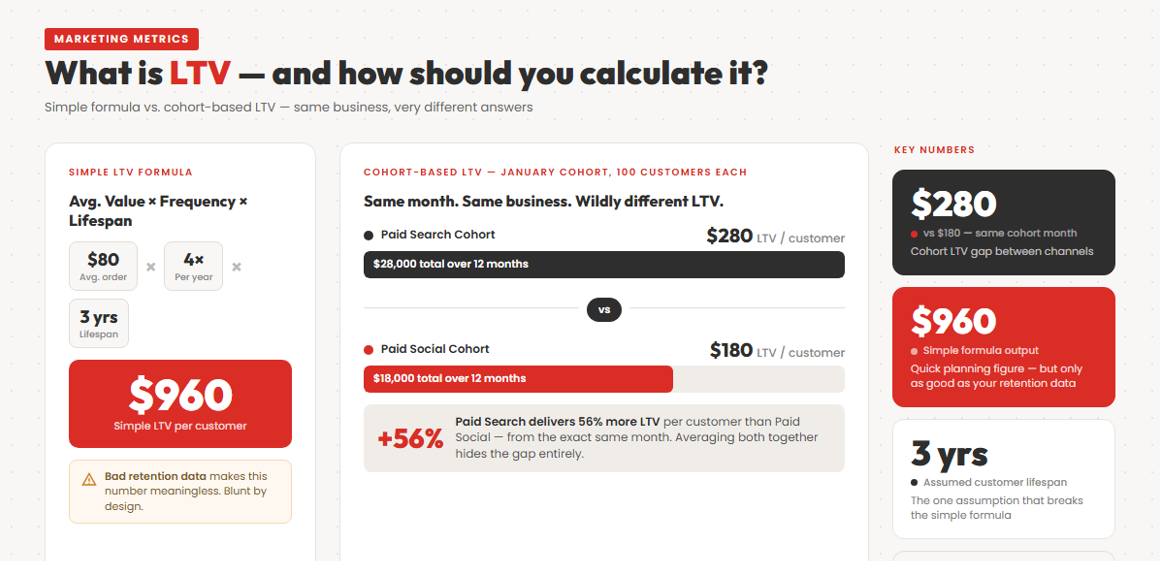
LTV stands for Lifetime Value. The simple LTV formula is:
LTV = Average purchase value × Purchase frequency × Average customer lifespan
Example: a customer spends $80 per order, buys 4 times per year, and stays for 3 years.
LTV = $80 × 4 × 3 = $960
That is useful for quick planning. It is also blunt. If your retention assumptions are bad, the number gets silly fast.
What does a cohort-based LTV calculation look like?
The better version is cohort-based LTV. This means measuring LTV by acquisition cohort, not averaging everyone together like they are the same customer. They are not.
Say your January paid search cohort has 100 customers. In month one they generate $12,000, then $4,000 in month two, then $3,000 in month three. Over 12 months, they generate $28,000 total. Their cohort LTV is $280.
Now compare that with a January paid social cohort of 100 customers that generates $18,000 over 12 months. That cohort LTV is $180. Same month. Same business. Very different customer value. A realistic LTV for a typical ecommerce startup can reach $300 per customer when you use sensible order value, frequency, and retention assumptions. That is a useful anchor — not an invitation to invent heroic retention.
What is a healthy LTV benchmark?
A healthy LTV is one that supports your CAC, margin, and payback period. Higher is always better, obviously. But “high” only matters if it is real.
For ecommerce, repeat purchase rate does the heavy lifting. For SaaS, retention and expansion matter more. For both, gross margin adjusted LTV is better than revenue-only LTV. A customer worth $300 in revenue is not worth $300 to the business. That part gets missed all the time.
What mistake do most teams make with LTV?
The biggest mistake is using average LTV across all customers. That hides channel quality. A customer from branded search may stick around for years. A discount-driven paid social customer may buy once and disappear.
The second mistake is using revenue instead of margin. If your product margin is weak, revenue-based LTV can make a bad channel look fine. Gross margin adjusted LTV is less flattering, which is exactly why you should use it.
The third mistake is assuming retention will improve later. Maybe it will. But until the data proves it, that is hope, not LTV.
Why is LTV:CAC the metric that ties everything together?
LTV:CAC is the single ratio that connects customer value to acquisition cost. It is the clearest health check in the stack — if the inputs are honest.
What is the LTV:CAC formula?
The formula is straightforward:
LTV:CAC = Lifetime Value / Customer Acquisition Cost
If your LTV is $900 and your CAC is $300, then:
LTV:CAC = $900 / $300 = 3:1
That means you generate $3 in lifetime value for every $1 spent acquiring a customer.
What does a worked LTV:CAC example look like?
Take an online supplement brand. Average 12-month LTV is $240. Fully loaded CAC is $80. So LTV:CAC = 3:1. There is room for operating costs and profit. If payback happens fast enough, you can scale without sweating every invoice.
Now take another brand. Average 12-month LTV is $150. Fully loaded CAC is $90. That gives you 1.67:1. You might survive. You probably will not enjoy scaling it.
According to research, the ideal healthy LTV to CAC ratio for ecommerce businesses is 3:1. and the median LTV:CAC ratio benchmark for healthy SaaS companies is also about 3:1. Different models, same basic lesson.
What is a healthy LTV:CAC benchmark?
The common benchmark is 3:1. Below 1:1, you are losing money on every customer. Around 2:1, you may have a workable model, but not much room for mistakes. Above 4:1, you may be under-spending and leaving growth on the table.
Still, timing matters. A 3:1 ratio is less impressive if it takes two years to recover the cash. Ratios do not pay payroll. Cash flow does.
What mistake do teams make with LTV:CAC?
They use bad inputs. Inflated LTV plus undercounted CAC gives you a beautiful ratio and a terrible business. This happens constantly.
If your LTV is based on blended averages and your CAC ignores salaries, tools, and agency fees, the ratio is basically motivational content. It looks great in a board deck. It does not help in real life.
What is MER and why is it the honest ROAS?
MER is the top-line view of marketing efficiency across your entire business — not just one platform or campaign. It is harder to game and closer to the truth than any single-channel ROAS number.
What is the MER formula?
MER stands for Marketing Efficiency Ratio. The MER formula is:
MER = Total revenue / Total marketing spend
If you spent $100,000 on all marketing this month and generated $500,000 in total revenue, then:
MER = $500,000 / $100,000 = 5.0
That means you made $5 in revenue for every $1 spent across the full marketing program. This is why people call it honest ROAS.
What does a MER example show that ROAS hides?
Say paid social shows 4.8 ROAS and Google Ads shows 6.2 ROAS. Everyone feels smart. Then you zoom out.
Total monthly revenue is $300,000. Total marketing spend is $120,000 once you include paid media, agency fees, email tools, freelancers, and content. Your MER is 2.5.
Channel dashboards say “winning.” The business-level number says “decent, but calm down.” Studies suggest that platforms overstate true ROAS by 2.3x on average. MER does not solve every attribution issue, but it is much harder to game because it uses total revenue and total spend.
What is a healthy MER benchmark?
A healthy MER depends on your margin structure. There is no universal benchmark. Your MER needs to support profitability after cost of goods, payroll, and overhead.
For many ecommerce brands, a MER above 3 is often decent. Some can live lower if repeat purchase is strong. Others need much higher because margins are thin or returns are brutal. Trend matters more than bragging rights. If MER falls while spend rises, you are probably scaling into inefficiency — and channel ROAS will not show you that.
What mistake do most teams make with MER?
The biggest mistake is not using it at all. Most teams stare at platform dashboards and never ask what the full system is producing. That is how you get “great campaigns” and a finance team that suddenly hates marketing.
The second mistake is excluding non-paid costs. If you call it MER, include the whole marketing effort. Otherwise you are just inventing another flattering version of ROAS.
What is the difference between CPA and CAC?
CPA measures the cost of a specific action. CAC measures the cost of an actual paying customer. They sound similar. They are not the same thing — and confusing them leads to very bad decisions.
What is the CPA formula?
CPA stands for Cost Per Acquisition or Cost Per Action. That naming mess is exactly why people confuse it with CAC. The formula is:
CPA = Campaign cost / Number of acquisitions or actions
If you spend $5,000 on a lead gen campaign and generate 100 form fills, then:
CPA = $5,000 / 100 = $50
That is a valid CPA. But those are leads, not customers.
How is CPA different from CAC in practice?
CPA is the cost to get a specific action — a lead, signup, booked demo, trial, or install. CAC is the cost to get an actual paying customer.
A campaign can have a fantastic CPA and awful CAC if the leads are junk. According to MarketingLTB, multi-touch attribution improves cost per acquisition efficiency by 14% to 36%, depending on channel mix. That is useful. But it still does not mean those acquisitions become customers unless your CRM says they do.
What does a CPA vs. CAC example look like?
A services business spends $12,000 on Google Ads and generates 240 leads. So CPA = $12,000 / 240 = $50 per lead. Looks efficient.
But only 20 leads become customers. Now the ad-spend-only CAC is $12,000 / 20 = $600. Add sales time, CRM cost, and agency support, and the real CAC might be $850. Same campaign. Same month. Very different story. Cheap leads can become expensive customers fast.
What mistake do most teams make here?
They celebrate low CPA without checking downstream quality. This is one of the oldest mistakes in lead gen.
The media buyer hits the target. Sales says the leads are trash. Revenue misses. Everyone starts using the phrase “lead quality” like it explains anything. If the action is not a customer, do not treat CPA like CAC.
How do these metrics connect in the real world?
No single metric tells the full story. Each one has a blind spot. The value comes from running them together, so they can check each other.
Why is one metric never enough?
ROAS can be inflated. CAC can be undercounted. LTV can be overestimated. MER tells you the top-level truth, but not which channel caused the problem. You need all six because they catch each other’s errors.
Data suggests that companies that implement multi-touch attribution report measurable improvements in CPA. The same source says B2B teams see an average 19% lift in marketing ROI in the first year after implementing multi-touch attribution. That is the practical value of connected measurement. Not prettier dashboards — better decisions.
What does a connected example look like?
Say a B2B company reports Meta ROAS of 5.0, Google ROAS of 4.2, and a lead CPA of $35. Sounds strong. Then the CRM shows only 8% of Meta leads become opportunities, while Google leads convert at 22%.
Now the story changes. Meta’s cheap leads become expensive customers. Google’s higher CPA produces lower CAC and stronger LTV. MER shows total efficiency is flat despite rising spend. Without that CRM connection, you scale the wrong channel and call it optimization.
Why does CRM linkage matter so much?
Ad platforms stop at the conversion they can see. Your CRM sees what happens next — lead quality, opportunity creation, close rate, deal size, repeat purchase, churn, and expansion revenue. That is where real performance lives.
This is the whole point of CRM and ad platform integration. Without it, you optimize for what is easy to measure, not what actually makes money. Approximately only two thirds of deployed customer data platforms deliver significant value. Buying more software is not the answer by itself. Wiring the right systems together is.
When teams do connect the stack, results improve. Multi-touch attribution can improve cost per acquisition and AI-powered CRM tools save sales and marketing teams an average of 12 hours per week. That time matters when you are trying to clean data, route leads, and actually trust your reporting.
FAQ
What is the best single marketing metric?
If you force a single pick, it is LTV:CAC. It connects customer value to acquisition cost. But it only works if both inputs are honest.
Is MER better than ROAS?
For business truth, yes. MER is broader and harder to game. ROAS is still useful for channel optimization, but MER is the more honest scorecard.
Should I use revenue or gross profit in these formulas?
Use gross profit where you can, especially for ROAS and LTV. Revenue is easier to pull. Profit is what keeps the lights on.
What is a good LTV:CAC ratio?
A common LTV:CAC ratio benchmark is 3:1. Healthy SaaS companies also sit around 3:1.
Can a low ROAS still be okay?
Yes. If margins are high, retention is strong, or customers buy repeatedly, a lower short-term ROAS can still work. That is why ROAS alone is never enough.
Why do marketers confuse CPA and CAC?
Because platforms report actions faster than businesses report customers. Leads and signups show up quickly. Revenue takes longer. Speed makes people sloppy.
So what should you actually do with these metrics?
Use ROAS to optimize channels. Use CAC to understand real acquisition cost. Use LTV to see what customers are worth over time. Use LTV:CAC to judge whether growth is sustainable. Use MER as the top-line reality check. Use CPA carefully, and only when you are crystal clear on what action you are buying.
When teams connect these metrics properly, performance improves. Companies with effective attribution see 15% to 30% higher ROI. Multi-touch attribution improves CPA efficiency by 14% to 36%. That is true operational upside.
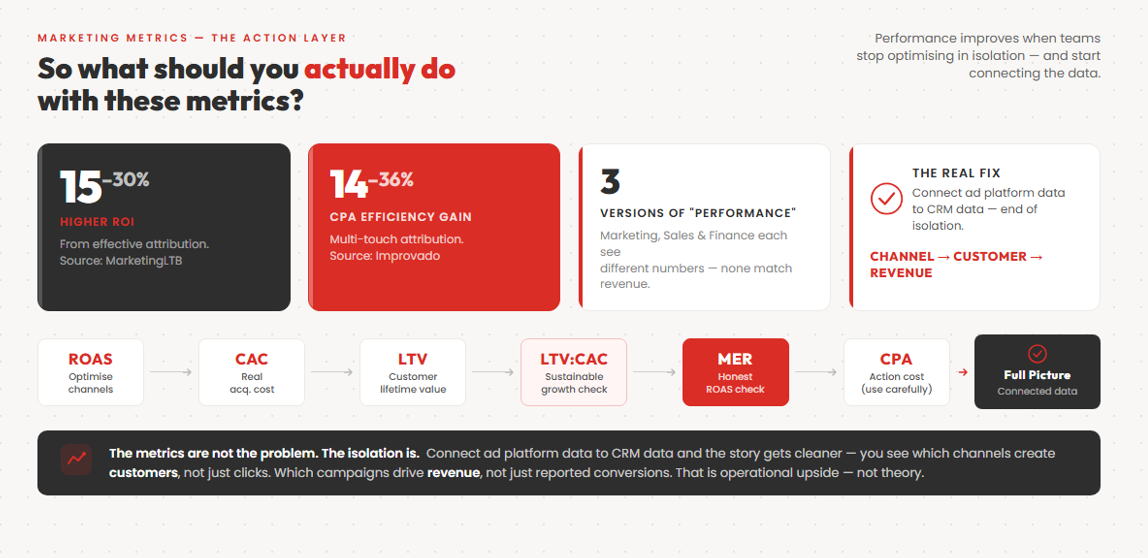
What is the real takeaway?
The metrics are not the problem. The isolation is. When ad platform data is disconnected from CRM data, every team optimizes a partial truth.
Marketing chases cheap conversions. Sales complains about lead quality. Finance questions the numbers. Leadership gets three different versions of “performance,” and none of them match the bank account.
Connect the data and the story gets cleaner. You see which channels create customers, not just clicks. You see which campaigns drive revenue, not just reported conversions. And you stop confusing dashboard success with business success.