This article will show you how to build reports like this one:
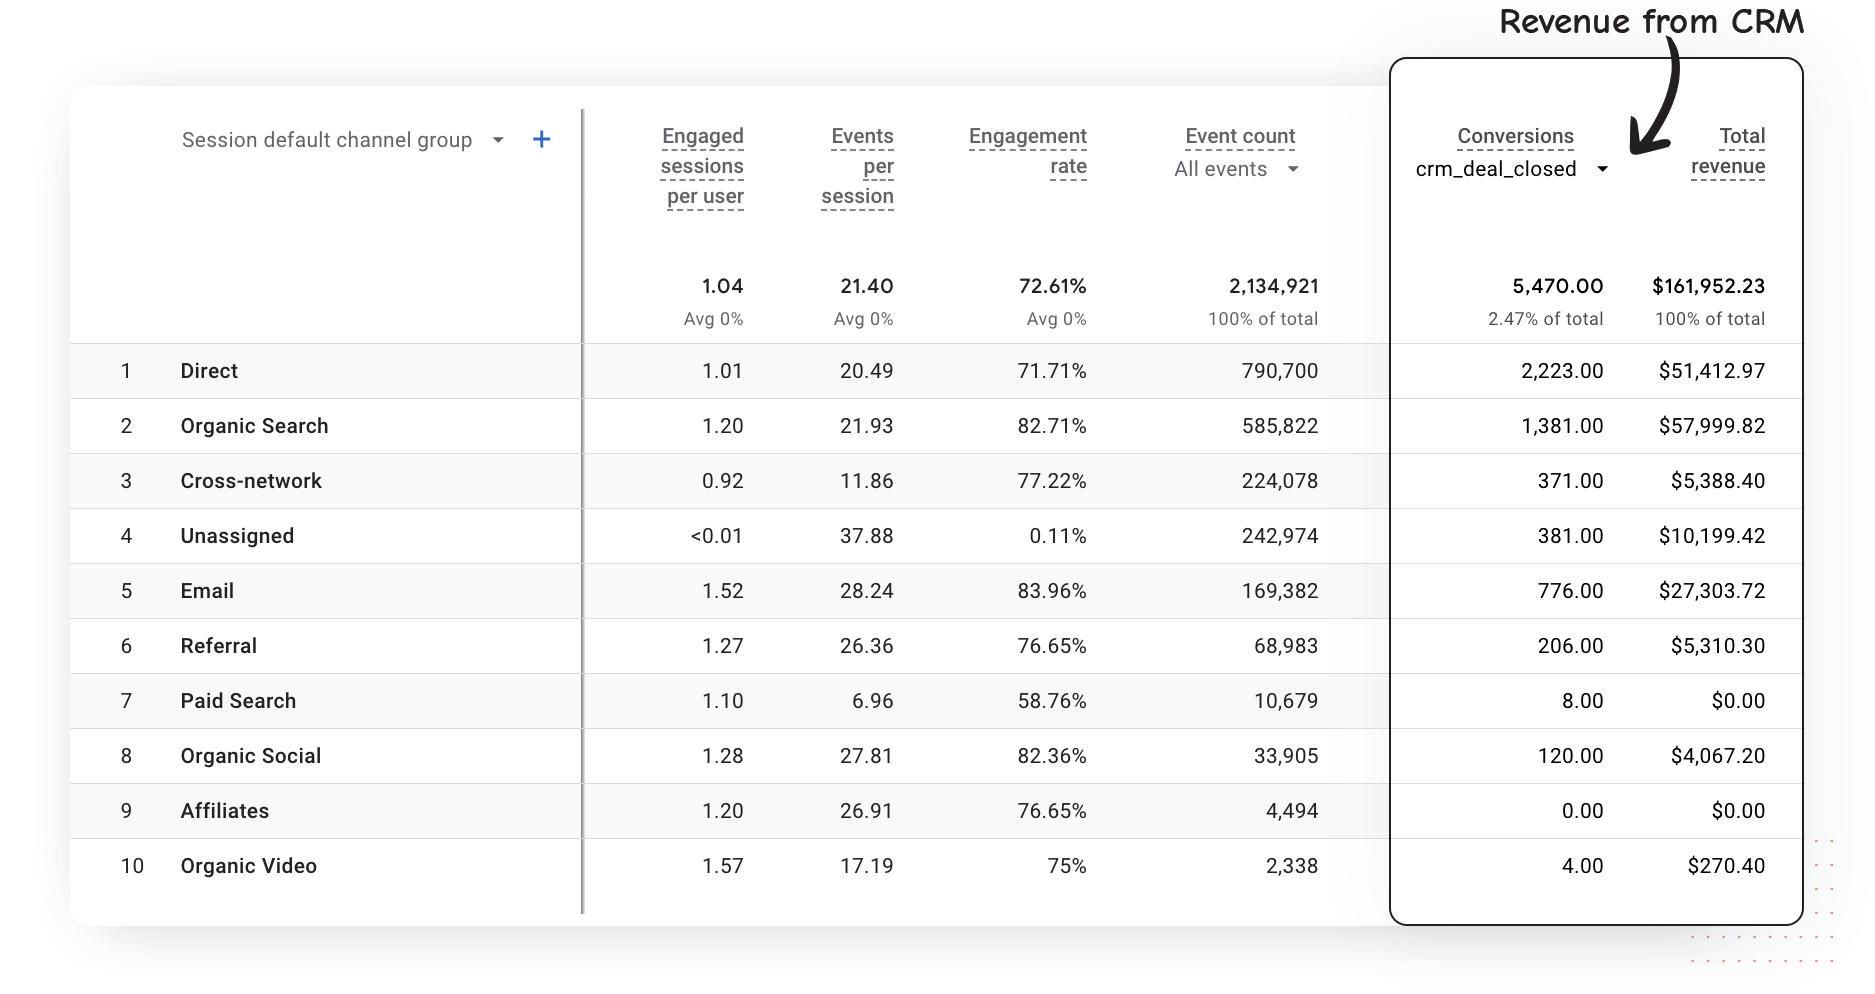
Having custom reports of site data that means the most to you can help you improve your business, drive more leads, and convert more customers. In this article, we’ll show you how to create custom reports in Google Analytics 4.
Step 1: Open the Explore Section
- Create a New Custom Report by going to Google Analytics > Explorations
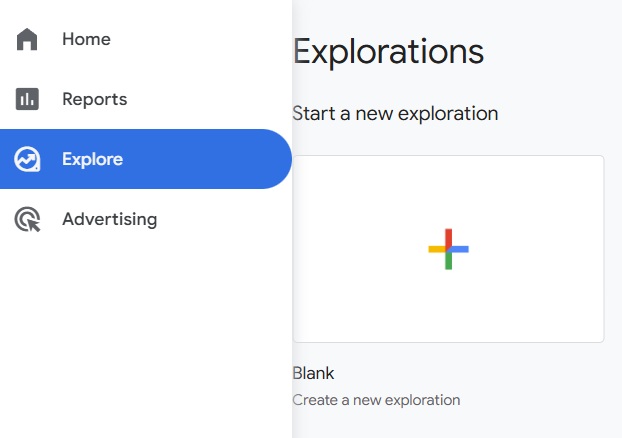
-
Click the + Blank option (or choose a template like Free Form, Funnel Exploration, or Path Exploration).
-
Give your exploration a name. In our example, we’ll keep it simple: CRM Leads Report.
- Each GA4 exploration can have multiple tabs, but for our example we’ll stick with one tab and keep the default name Tab 1.
Step 2: Choose the Report Technique
GA4 offers different techniques (similar to UA’s “report types”):
-
Free Form – Most flexible. Works like the standard UA “Explorer” type, with tables, charts, and filters.
-
Funnel Exploration – Shows user progression through steps.
-
Path Exploration – Visualizes navigation paths.
-
Segment Overlap – Compares multiple audience segments.
-
User Explorer – Looks at individual user journeys.
For our example, we’ll choose Free Form, which most closely matches the old “Explorer” type.
Step 3: Add Metrics
In GA4, metrics are added from the Variables panel on the left.
-
Under Metrics, click the + icon.
-
Search for and select the metrics you want.
In our example, we’ll include:-
Session default channel group
-
Engaged sessions per user
-
Events per session
-
Event Count
-
Salesforce Opportunities Closed Won
-
Salesforce Opportunity Amount
-
-
Click Import to add them to your exploration.
Step 4: Add Dimensions
Dimensions let you break down your metrics into categories, similar to UA.
-
Under Dimensions, click the + icon.
-
Search for and select:
-
Salesforce Leads Created (imported via GA Connector events)
-
Salesforce Opportunities Created
-
Source / Medium (or another dimension you want).
-
-
Click Import.
Step 5: Apply Filters (Optional)
If you want to limit the data shown, add a filter:
-
In the Tab Settings panel, find the Filters section.
-
Drag in a dimension (e.g., Source / Medium) and set your condition.
Example: Include only traffic from Google / CPC.
Step 6: Arrange Your Report
Your setup might look like this:
-
Rows: Session default channel group, Engaged sessions per user, Events per session, Event Count, Salesforce Leads Created, Salesforce Opportunities Created etc.
- Values: Salesforce Opportunities Closed Won, Salesforce Opportunity Amount etc.
-
Filters: Optional conditions
You can also switch between table, bar chart, or line chart visualizations in the Tab Settings panel.
Step 7: Save and View Your Report
When you’re happy with your setup:
-
Click Save at the top right.
-
Your custom GA4 exploration is now ready.
-
You can revisit it anytime under the Explore tab.
Note: If you are using Zoho CRM, Pipedrive or Hubspot you might have different key events. Also, this is just an example on how to create the report, you can add different Dimensions or Metrics in your report.
And that’s it! You now know how to create a custom report in GA4 using the Explore workspace. Once saved, your report will immediately display live data.
Once you click save, you’ll automatically see your custom report data.

