ROAS (Return on Ad Spend) is the revenue you earn for every dollar spent on advertising, written as a ratio. You calculate it by dividing ad revenue by ad spend. A 4:1 ROAS means four dollars back for every dollar in. The catch: the number is only as honest as the attribution data behind it.
That last part is the whole reason this guide exists. Anyone can calculate ROAS in ten seconds. Almost nobody calculates it on numbers they can trust.
So we’ll do both. The formula, the examples, the benchmarks. And then the uncomfortable part: why a 4:1 ROAS in your dashboard might actually be a 2:1 in real life, and what to do about it.
What ROAS Actually Means
ROAS answers one blunt question about your advertising campaigns: I put a dollar into ads, how many dollars came back. A 4:1 ROAS means four dollars of revenue for every dollar of spend. Measuring ROAS is how most teams decide whether a campaign is worth keeping.
You’ll see it written as a ratio (4:1), as a plain number (4), or as a percentage (400%). All three say the same thing. It’s the marketing metric ad platforms lean on hardest, because it maps cleanly to the one thing every marketer gets asked: is this making money.
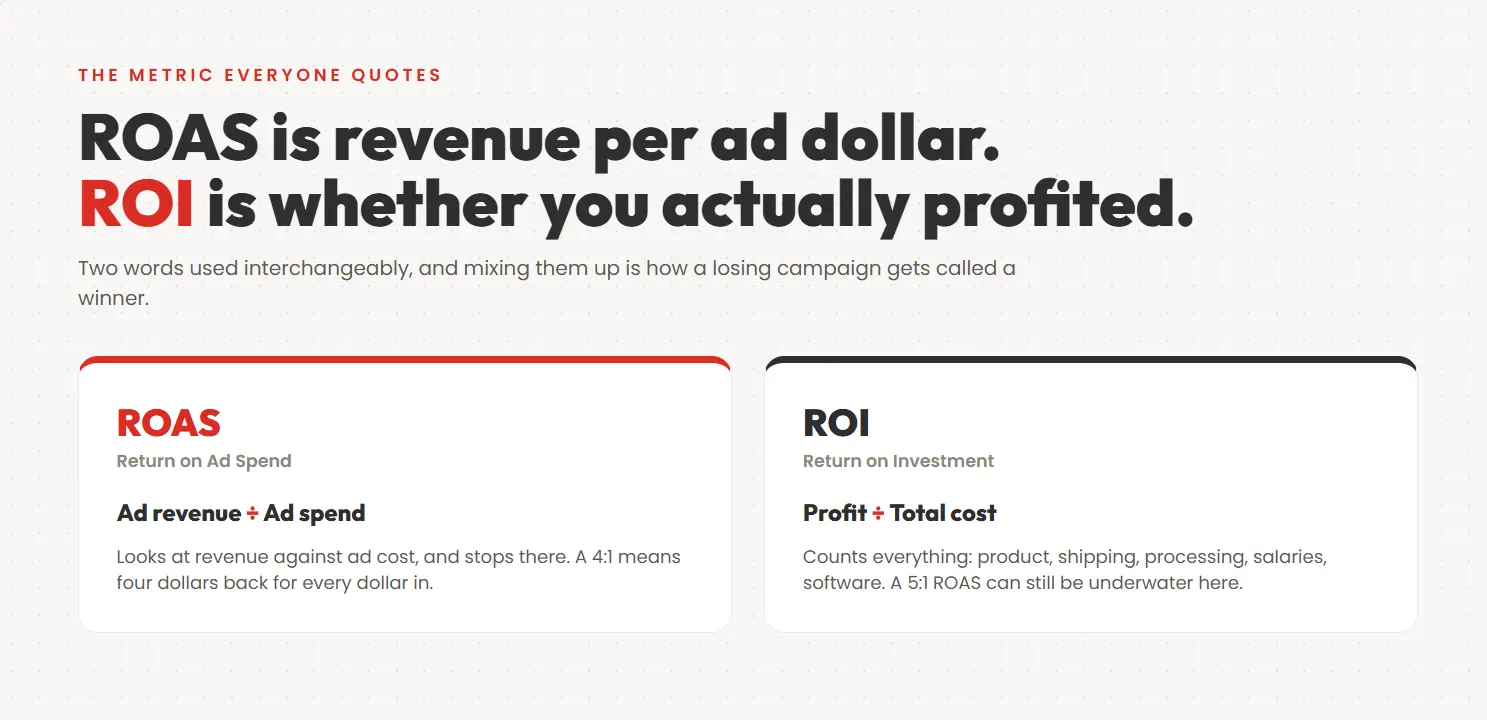
It sounds like ROI, and people use the two words as if they’re interchangeable. They’re not, and mixing them up is how businesses convince themselves a money-losing campaign is a winner.
ROAS looks at revenue against ad spend and stops there. ROI looks at profit against everything you spent to earn it: the ads, yes, but also the product cost, the shipping, the payment processing, the salaries, the software.
You can post a gorgeous 5:1 ROAS and still be underwater on ROI if your margins are thin enough — strong ad efficiency that does nothing for your overall profitability. We’ll come back to that, because it’s the single most expensive misunderstanding in this whole topic.
Why Everyone Reaches For ROAS First
Because it’s sitting right there. Meta, Google, TikTok — every paid ads platform prints a ROAS number in the dashboard without you lifting a finger, and most will even automate a bidding strategy around a target ROAS you set.
You don’t have to stitch three systems together or build a report. It’s one number you can drop into a Slack message to your boss, and your boss gets it instantly: working, or not working.
That convenience is exactly why it’s so dangerous. The easiest number to grab is rarely the most accurate one, and ROAS is the poster child for that trade-off.
The ROAS Formula, and How To Calculate It
Here’s the ad spend formula, and it’s not going to surprise anyone:
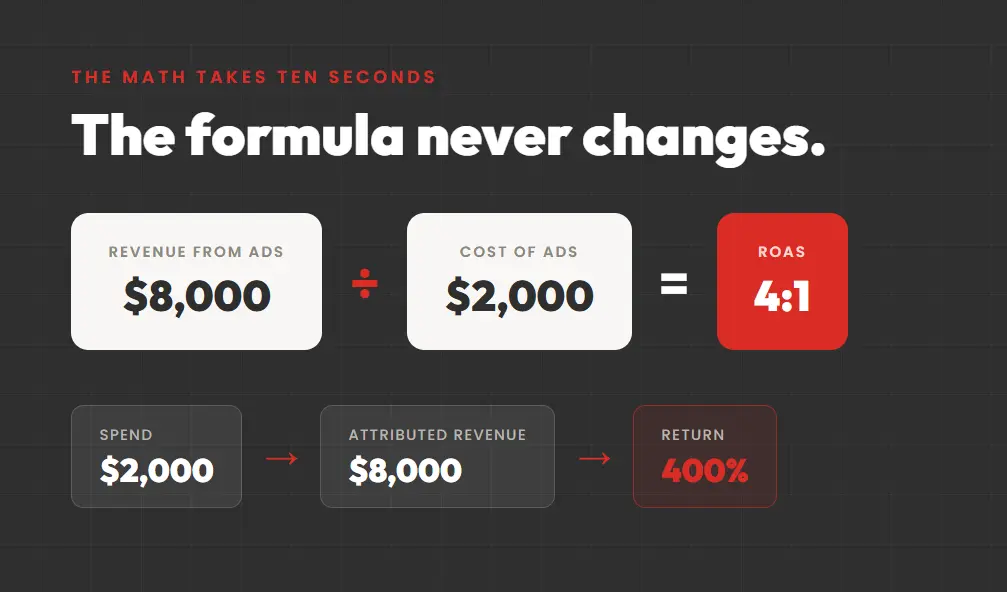
Revenue from ads ÷ Cost of ads = ROAS
Multiply by 100 if you want a percentage. Leave it alone if you want a ratio. That’s the entire calculation — no ROAS calculator required, though plenty exist.
If the math were the hard part, nobody would need a guide. You’d need a fourth-grade division worksheet. The hard part is deciding which two numbers go into the equation, because both of them are slipperier than they look.
Walk Through a Real Calculation
Say you ran a Google Ads campaign last month. Your total ad spend was $2,000. Google’s dashboard tells you the campaign drove $8,000 in revenue.
Eight thousand divided by two thousand is four. Congratulations, 4:1 ROAS, 400%, break out the champagne. For context, that’s a strong result. WebFX’s 2025 analysis put the average paid-search ROAS at 2.26x, so 4x is well above the pack.
But where did that $8,000 come from? Did $8,000 actually hit your bank account, tied to sales that closed and cleared?
Or is it $8,000 of “conversion value” that Google assigned based on its own attribution rules? Some of that revenue is sales other platforms are also claiming credit for. Some of it is leads that haven’t paid you a cent yet.
The number 4 is only as good as that $8,000, and the $8,000 is doing a lot of quiet work.
What Belongs In the “Revenue” Slot
Revenue should mean closed, collected money. Not leads. Not form fills. Not “estimated lifetime value” and not “pipeline.”
This matters most for anyone with a sales team, because the temptation is enormous. A lead comes in, your CRM slaps a $10,000 potential deal value on it, and suddenly your ROAS math is counting money that may never arrive.
Half those deals might fall through. If you calculate ROAS on pipeline instead of closed revenue, you’re not measuring performance, you’re measuring optimism.
For e-commerce it’s cleaner (a sale is a sale), but even then, returns and refunds should come out. A campaign that sells a lot of stuff that comes right back isn’t a campaign with a good ROAS. It’s a campaign with a good return rate.
What Belongs In the “Spend” Slot
Advertising spend is the number people fudge without even realizing it. The obvious part is the media cost, what you paid the platform. But your true advertising costs run wider than that.
But if an agency runs your account and takes 15% on top, that 15% is part of the cost of those ads. Leave it out and you’re flattering yourself.
Same with the tools you’re paying for specifically to run and optimize the campaign. Be honest about the denominator or the whole ratio is fiction.
There’s No Such Thing As a Universally “Good” ROAS
People desperately want a magic number. “Is 4:1 good?” There is no answer to that question in a vacuum, and anyone who gives you one is guessing.
A good ROAS depends entirely on your gross margin, and margins vary wildly between businesses. The spread in the benchmark data is enormous: WebFX’s 2025 paid-search figures run from 0.7x in financial services to 6.86x in heavy equipment. A single “industry average” hides all of that.
A SaaS company with an 80% profit margin can be wildly profitable at 2:1. It keeps most of every dollar, so it doesn’t need much revenue to cover the ad cost and clear a profit.
A retailer selling physical goods at 20% margin can be losing money at that exact same 2:1. After the cost of goods there’s almost nothing left to cover the ad spend. Same ratio, opposite outcome. The ratio alone tells you nothing.
Break-Even ROAS Is the Number That Actually Runs Your Account
Forget the “4:1 is good” rule of thumb. The number that matters is your break-even ROAS — the break even point where a campaign stops losing money — and it’s easy to find:
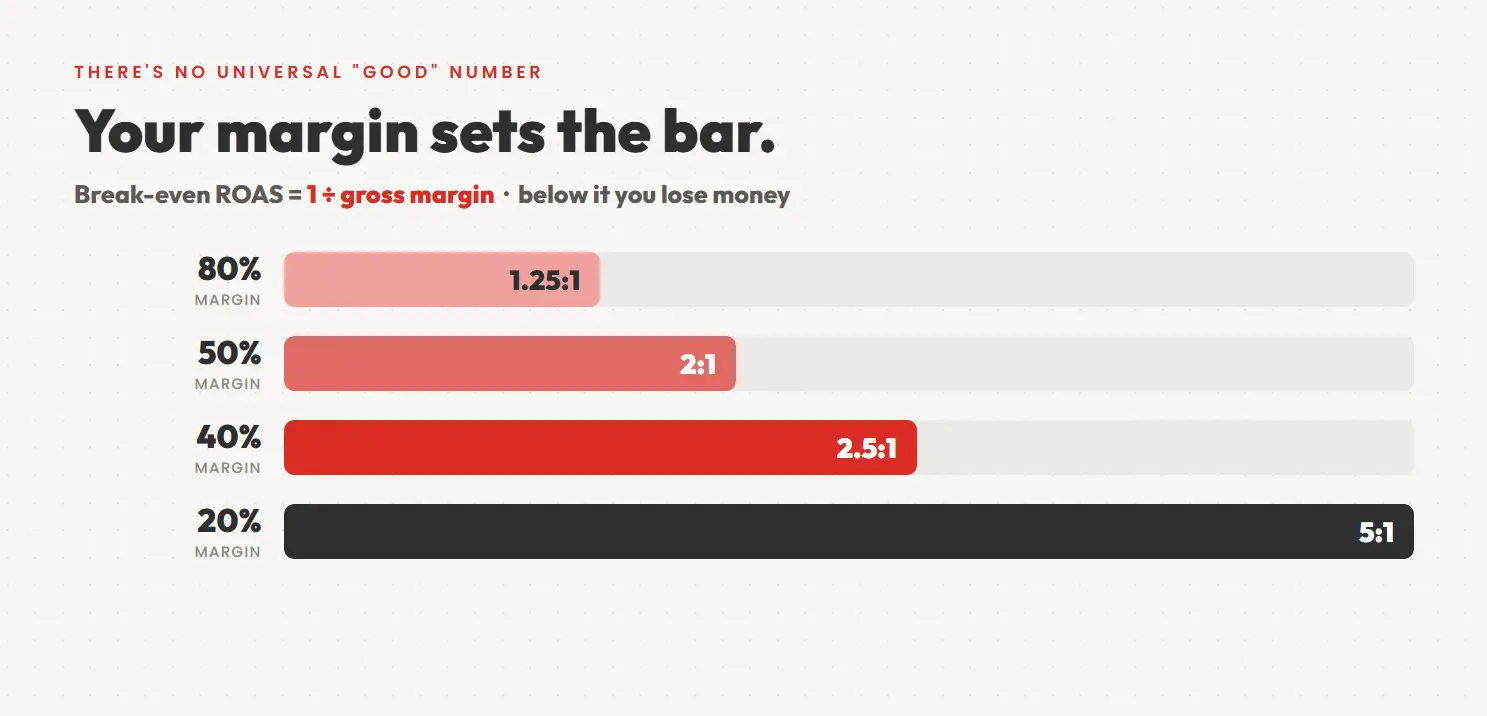
Break-even ROAS = 1 ÷ gross margin
Margin of 40%? Your break-even is 1 ÷ 0.40 = 2.5. That means at 2.5:1 you’re exactly at zero. Every dollar of ad spend earns back just enough to cover the product cost and the ad itself, nothing left over.
Below 2.5 you’re losing money. Above it you’re actually making some. Foundry’s benchmark data lays out the same math: at a 50% margin break-even is 2:1, at 20% it’s 5:1.
A 3:1 ROAS is a genuine win on a 40% margin and a genuine loss on a 20% margin. If you don’t know your break-even number, you literally cannot tell which situation you’re in.
This is why “good ROAS” benchmarks floating around the internet are close to useless. A benchmark that doesn’t know your margins doesn’t know your business.
Calculate your own break-even, set your target ROAS above it with room for overhead and profit, and ignore the generic charts.
Don’t Forget Lifetime Value
One more wrinkle, because it cuts the other way. If a customer buys once and vanishes, first-purchase ROAS is the whole story.
But say they come back and buy again — subscriptions, consumables, anything with repeat purchase. Judging a campaign purely on the first sale undersells it badly. A 1.5:1 ROAS on the first order can be a monster win if that customer is worth five more orders over the next year.
This is why sophisticated teams set different ROAS targets by campaign role. One 2026 benchmark breakdown suggests branded campaigns at 8x–12x, prospecting at 2x–4x, and retargeting at 5x–8x. They play different roles in the same journey, and a single blended target papers over all of it.
Why ROAS Misleads You Without Proper Attribution
This is the part nobody puts on the slide. Everything above assumes the revenue number is correctly attributed to the right campaign. It usually isn’t.
The default attribution model behind almost every ROAS figure you’ll ever see is last-click, and last-click is a liar by design. It’s still shockingly common: one 2025 industry survey found 41% of marketers still rely on last-touch despite knowing it’s flawed.
Last-click gives 100% of the credit to whatever the customer touched last before converting, and 0% to everything that came before. In a world where people click one ad and buy immediately, that’d be fine.
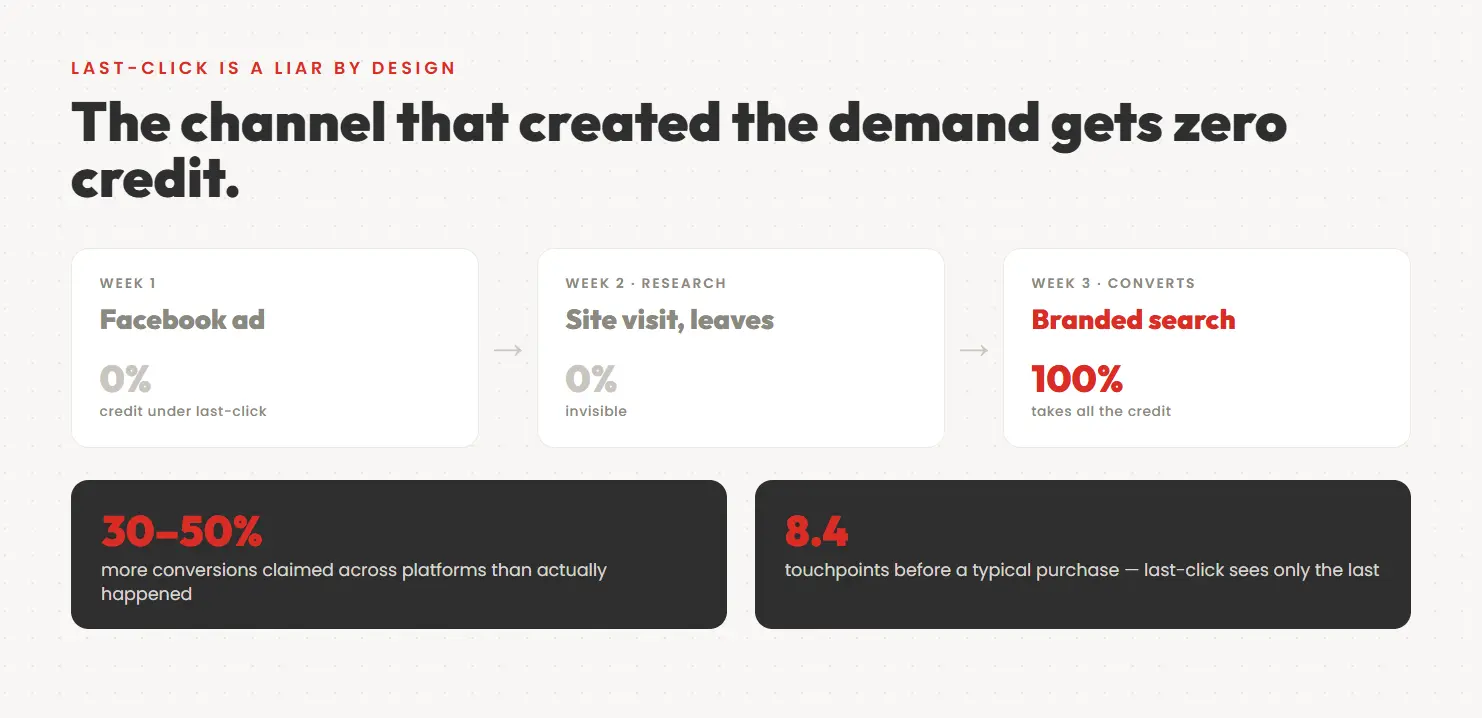
That is not the world. According to research cited by Numen Technology, buyers now hit an average of 8.4 touchpoints before converting, up from 5.2 in 2020. For B2B purchases over £10,000 that number climbs past 14. Last-click erases every one of those except the final step.
The Trap That Kills Your Best Channels
Here’s the scenario that plays out in real accounts constantly. Someone sees your Facebook ad, gets interested, pokes around your site, then leaves.
Two weeks later they remember you, Google your brand name, click the result, and buy. Last-click hands Google 100% of that sale. Facebook gets nothing.
Now look at your dashboard. The Facebook campaign shows a terrible ROAS. It spent money and “generated no revenue.” The branded search shows a fantastic ROAS.
So the obvious move, the one a smart data-driven marketer makes, is to shift the budget allocation away from Facebook and pour more into search. It’s the kind of advertising strategy decision that looks data-driven and is quietly backwards — Facebook was the thing that created the demand in the first place.
That branded search only happened because the person saw the Facebook ad. Kill Facebook and the branded searches dry up too, and three months later you’re wondering why the whole account is cratering.
This isn’t hypothetical. A B2B cybersecurity company profiled by MCP Analytics ran the numbers on 14 months of data. Content marketing, which looked like 8% of conversions under last-click, actually influenced 29% of deals. Paid search deserved credit for far less than the 55% of budget it was eating.
Every Platform Is Grading Its Own Homework
Meta reports its ROAS. Google reports its ROAS. TikTok reports its ROAS. Every one of them has a commercial incentive to take credit for as many conversions as possible, and their attribution windows overlap.
The same single sale can get claimed as a win by two or three platforms at once. This isn’t a bug. As Databox puts it, platform dashboards were built to justify continued ad spend, not to measure marketing’s true contribution.
Add up the revenue each platform says it drove and the total blows past reality. Multiple 2026 analyses find platforms collectively claim 30% to 50% more conversions than actually happened. C3 Metrics has documented aggregate claims that imply a company two to four times its real size.
So your Meta dashboard says 4:1 and your Google dashboard says 5:1. Those numbers aren’t measuring the same reality, they’re not additive, and neither one is neutral. They’re marketing materials the platforms produce about themselves.
View-Through Conversions Inflate the Story Further
Then there’s view-through attribution. A platform counts a sale because someone saw an ad (didn’t click it, just had it render on screen) and later bought.
Sometimes that impression really did influence the purchase. Often it’s coincidence dressed up as causation. C3 Metrics estimates Meta’s reporting shows about 26% more conversions than site-side analytics, driven by view-through and modeled conversions. Google over-attributes by an estimated 15–20%.
If your reported ROAS leans heavily on view-through, treat it with real suspicion.
Offline and Delayed Sales Break the Model Entirely
For anyone whose sales close offline — B2B, high-ticket services, anything with a sales team and a phone — the standard ROAS calculation isn’t just imprecise. It’s structurally broken.
Ad platforms are built to measure fast digital conversions. They are not built for a lead who fills out a form today, gets a sales call next week, and signs a month later. B2B sales cycles average 92 days, and enterprise deals run far longer. Most of that journey happens after the platform’s attribution window has already closed.
That revenue closes in your CRM, completely out of sight of Google and Meta. Unless something actively pushes that offline conversion data back into your analytics, the campaign that generated your best customer looks like it generated nothing.
So the highest-value channel in the account can show the worst ROAS on the dashboard, purely because its revenue never made it back into the report. The scale of the blind spot is real. One analysis of a 147-day sales cycle found 68% of conversions showed up as “direct” with no source — because the original touch fell outside a 30-day window.
Teams cut their best-performing channel all the time for exactly this reason. And they never find out, because the tool that told them to do it also hid the evidence. Tracking ROAS properly means seeing which advertising initiatives actually earned the revenue, not just which one was touched last.
How To Fix ROAS So the Number Tells the Truth
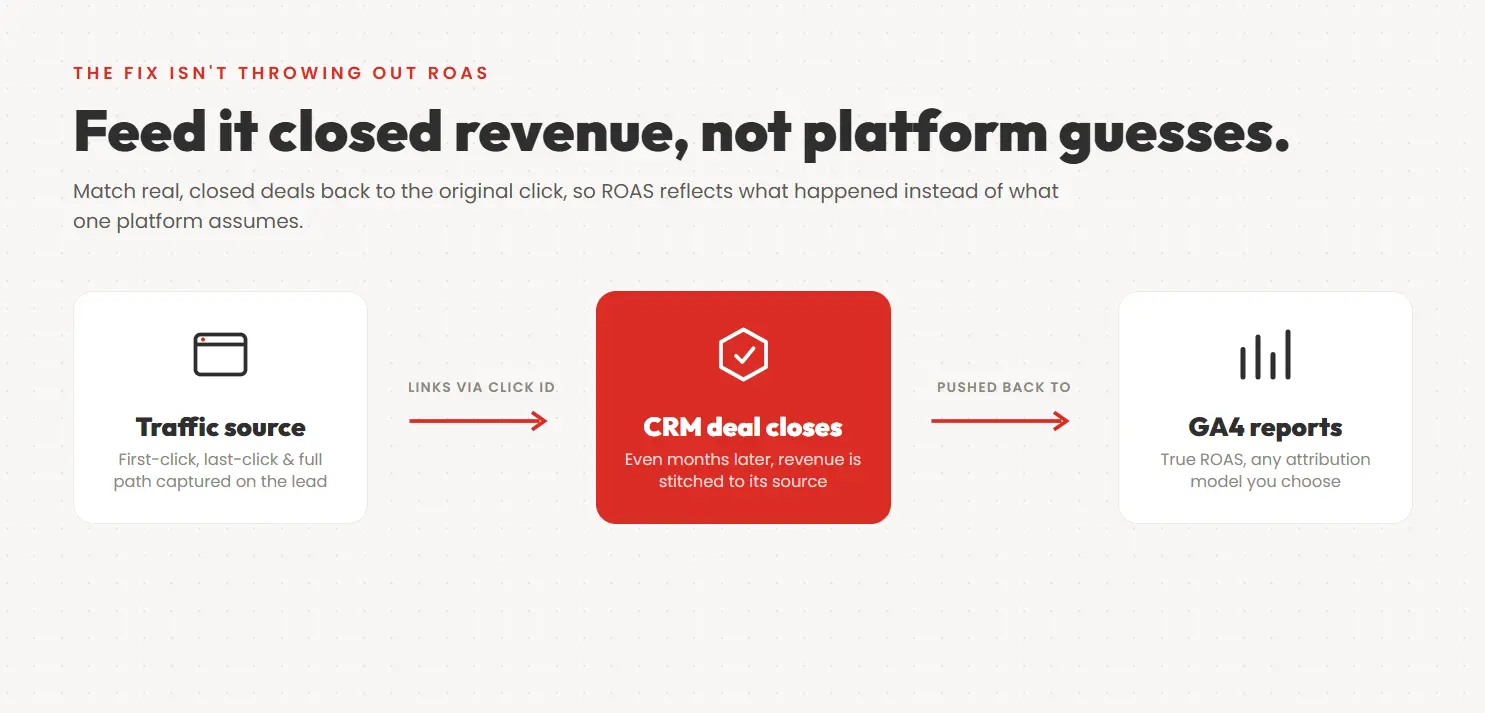
Good news: the fix isn’t throwing out ROAS. It’s a useful metric once it’s fed honest data.
The fix is closing the loop between where deals actually close (your CRM) and where traffic gets tracked (your analytics). When real, closed revenue gets matched back to the original traffic source, ROAS stops being a platform’s opinion and starts being a fact.
Connect Closed Revenue Back To Its Real Source
The core move is stitching CRM revenue to the original click data. Every lead has an origin story: a first click, a last click, and a whole sequence of touches in between.
Carry that origin data all the way through to the closed deal, and you can attribute the revenue generated back to the source that actually earned it. Even months after the first ad was clicked.
This is the specific gap GA Connector exists to close. It captures the traffic source of every visitor who fills out a form and attaches it to the CRM record: first-click, last-click, and the full multi-touch path.
Then it pushes closed-deal revenue from the CRM back into GA4, using the visitor’s original click as the link. So a deal that closes eight weeks after the first Facebook ad still gets credited to Facebook. It lands in a report you actually trust, instead of vanishing into a last-click black hole.
For businesses with long sales cycles, that’s the difference between a ROAS number that reflects reality and one that’s actively steering you wrong. It’s worth the effort. Companies using attribution platforms are 2.3x more likely to increase ROAS year over year.
First-Click Data Rescues Your Top-of-Funnel
Once you’re capturing first-click alongside last-click, that Facebook-then-branded-search scenario resolves itself. The channel that started the journey gets visible credit for starting it.
Run this on a real account for the first time and it’s common to discover something uncomfortable. A channel you were about to cut for “bad ROAS” was quietly kicking off your most valuable customer journeys the whole time.
That’s not a small reporting nicety. That’s a channel you were about to kill, saved.
Recalculate Under Multiple Attribution Models
The deeper win is optionality. Once closed revenue lives in a system that can apply different attribution models — first-click, last-click, linear, time-decay, data-driven — you can view the same campaign through every lens instead of being trapped in last-click.
Last-click might say a channel is worthless. Linear might show it’s touching 60% of your deals. Data-driven might land somewhere sensible in between.
Seeing all of them at once is how you stop making million-dollar decisions on the single most misleading model available. The teams that do this pull ahead. 74% of high-growth companies use multi-touch attribution, versus a minority of the field overall.
How To Report ROAS Without Fooling Your Own Team
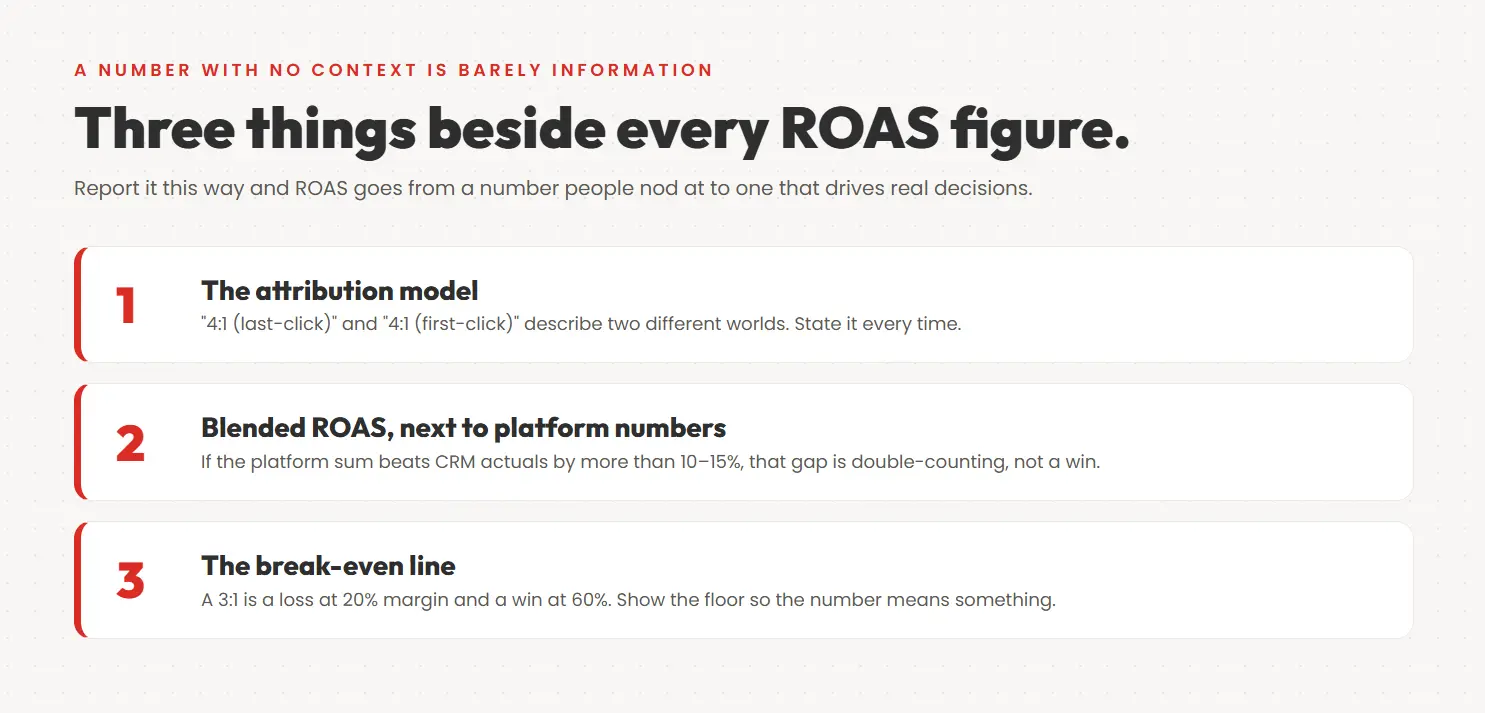
A ROAS number with no context attached is barely information. If you’re the one reporting it, you owe the people reading it three things, every time.
Say which attribution model produced it. “4:1 ROAS (last-click)” and “4:1 ROAS (first-click)” describe two different worlds. Leave the model unstated and you’re hiding the biggest assumption in the whole number. State it in the same breath as the figure, always.
Report blended ROAS next to the platform numbers. Blended ROAS is total spend across all channels divided by total real revenue. You measure it once in a neutral place — your CRM or GA4 — instead of summing up each platform’s self-flattering dashboard.
It’s almost always lower than the platform numbers added together, and that gap is your clearest measure of double-counting. Databox recommends a weekly check: if the platform sum exceeds CRM actuals by more than 10–15%, flag it as a tracking-quality problem, not a win.
Put break-even ROAS right beside the actual ROAS. A 3:1 on a 20% margin product is a loss dressed up as a win. The same 3:1 on a 60% margin product is a strong win.
Nobody reading your report can tell the difference unless you show the break-even line next to the result. Show it. Every time.
Do those three things and ROAS goes from a number that gets people nodding along to a number that actually drives good decisions about where your advertising efforts belong. That’s the entire point of measuring anything.
FAQ
What is a good ROAS?
There isn’t a universal one, and be skeptical of anyone who quotes you a magic figure. A good ROAS is any number comfortably above your break-even ROAS, which you get by dividing 1 by your gross margin.
At a 40% margin, break-even is 2.5:1, so “good” starts above that. At an 80% margin, you can profit below 1.5:1. For reference, average paid-search ROAS sits around 2.26x, but your margin sets your bar, not the average.
How do you calculate ROAS?
Divide the revenue attributed to a campaign by what you spent on that campaign. An $8,000 return on $2,000 of spend is a 4:1 ROAS, or 400%.
The math is trivial. The accuracy lives entirely in whether that revenue figure reflects real closed sales attributed to the right source, rather than pipeline value or platform-inflated conversion credit.
What is the ROAS formula?
Revenue from ads divided by cost of ads. Multiply by 100 for a percentage. That’s it.
The formula never changes. What changes, and what determines whether the output means anything, is the quality of the two numbers you feed into it.
What is the difference between ROAS and ROI?
ROAS compares revenue to ad spend only. ROI compares profit to your total investment: ad spend plus product cost, fulfillment, tools, salaries, all of it.
A campaign can show a strong ROAS and a losing ROI at the same time if your margins are thin. ROAS is a media-efficiency metric; ROI is a business-profitability metric. Don’t let anyone treat them as the same thing.
Why doesn’t my platform-reported ROAS match my actual revenue?
Because platforms grade their own homework. Overlapping attribution windows let two or three platforms claim the same sale. View-through conversions credit ads people only glanced at. Together they routinely inflate platform-claimed conversions by 30–50% over reality.
On top of that, offline or delayed sales that close in your CRM never make it back into the ad platform at all. Blended ROAS, measured independently in GA4 or your CRM, is almost always the more honest number.
Can ROAS be too high?
Counterintuitively, yes. A very high ROAS on a small budget can mean you’re underspending and leaving scale on the table, not that you’ve achieved perfect efficiency.
If a campaign is returning 12:1, that’s often a signal to test a bigger budget rather than a ceiling to protect. Efficiency and total profit aren’t the same goal, and maximizing the ratio sometimes means minimizing the money you actually make.