In 2015, I was struggling to make sense of my marketing data in Google Analytics. I didn‘t know which of my marketing campaigns actually worked, and which ones were burning my hard-earned money.
So I decided to learn all the nitty-gritty details of Google Analytics that I can. I studied the world‘s top Google Analytics pros in the world – guys like Justin Cutroni, Avinash Kaushik and Simo Ahava. This article is a collection of the best Google Analytics tips that I learned from them. I hope you enjoy these hidden gems as much as I do. 🙂
1. Are You Overestimating Your Traffic Numbers?
Google Analytics reports may be leading you to significantly overestimate the traffic from some channels
Most of us tend to rely on Google Analytics to estimate how much traffic each marketing channel brought to the website.
But the way Google Analytics works by default, it can lead you to overestimate the importance of some channels.
You see, Google Analytics may attribute a direct session (one that is started by entering the URL in the browser) to indirect channels.
Let‘s use an example.
Let‘s say that a user initially came to your site from organic search, and then came back 9 times.
In this case, Google Analytics will show you that there were 10 sessions brought by organic search.
This may result in a very distorted representation of traffic.
How to fix this?
Just active the secondary dimension “Direct Session” in your reports.
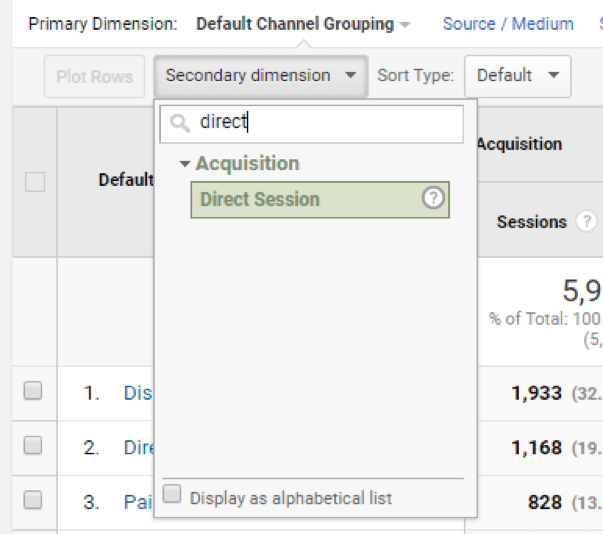
P.S. By the way, this explains why your Adwords clicks and Analytics sessions numbers are so far off.
Source: keyword-hero.com
2. Is Adwords Stealing Your Organic traffic?
Your Adwords ads may be competing with your organic search rankings on Google. Here is how you can know for sure.
If you organically rank for some of the keywords you‘re advertising for, you may be wasting your advertising dollars.
Because if you rank high enough for a given keyword, it doesn‘t make sense to advertise for it.
I suspected that this may be the case for my Adwords campaigns, so I decided to check this using some basic statistics.
In statistics, there is a term called correlation, which stands for a statistical relationship between two variables.
If Adwords has a negative impact on organic search traffic, these variables should be negatively correlated.
So I measured the correlation between Adwords and organic search traffic.
It turns out that the correlation was -0.113, which is weak.
My fears about Adwords “stealing” organic traffic were not supported by data, so I keep investing in this channel in peace. 🙂
Here is how you can check if YOUR Adwords campaigns are “stealing” your organic search traffic:
1. Go to Google Analytics > Acquisition > All Traffic > Source/Medium
2. Create 2 segments: Adwords and Google Organic.
3. Export at least 90 days of data to CSV.
4. Transform data from your CSVs to single Google Spreadsheet so it looks like this:
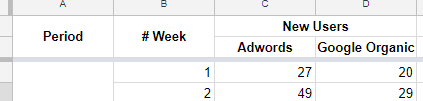
6. Then, use CORREL() function to find out if there is a correlation between these segments of traffic.
Interpreting this correlation coefficient requires some math skills, but the rule of thumb is that:
- 0 to -0.2 is a very weak correlation, never mind it;
- -0.2 to -0.4 is a weak correlation, but worth paying attention to;
- everything lower than -0.4 is a strong correlation.
3. Make Your GA Reports More Readable
After implementing these simple tips, your GA reports will become more readable & easier to drive conclusions from
Have you noticed that Google Analytics sometimes shows one page as two different ones?
Example:
- /pagename
- /pagename?nav=1
- /PAGENAME
As a result, metrics in your reports are spread between these two pages (even though it‘s actually the same page).
Making it harder to analyze your results.
Same for campaign name, mediums etc.
If someone used “&medium=CPC” in a UTM tag, instead of more common “&medium=cpc”, GA will consider it as a different medium.
Which will make your reports a lot harder for you to read.
How to fix this?
1. Go to Google Analytics – Admin – View Settings – Exclude URL Query Parameters.
Then, input the common URL parameters that in case of your website don‘t count as separate pages.
2. Go to Go to Google Analytics – Admin – Filters, and add a filter that looks like this:
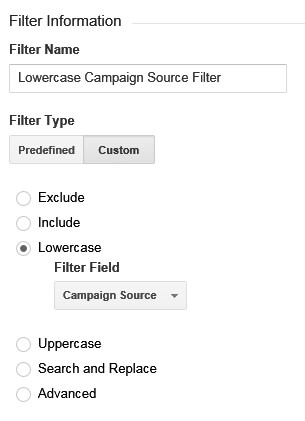
It‘s also a good idea to create the same filters for:
+ Campaign name, term and medium
+ Request URI
Source: www.amazon.com
4. Make You GA Reports Twice More Accurate
Just click on this one little checkbox to make your Google Analytics reports up to twice as accurate
Do you know that for most websites, bot traffic accounts for 63% to 80%?
Some of them are “good bots” (e.g. RSS readers).
But “bad bots” (e.g. spammers, impersonators, hackers) account for a staggering 27% of all web traffic, at least (according to a study by Incapsula.com).
Thankfully, Google Analytics has an easy way to eliminate them:
1. Go to Google Analytics – Admin – View Settings.
2. Check “Exclude all hits from known bots and spiders” under “Bot Filtering”.
That‘s it!
Source: www.lunametrics.com
5. Avoid This Critical Google Analytics Mistake
Avoid this Google Analytics mistake that can seriously mess up your web analytics
You worked so hard to set up Google Analytics on your company‘s or your client‘s website.
But are you sure it works as intended?
Sometimes, there is a JavaScript error or something else went wrong, that could mess up the tracking.
To make sure that GA works properly, you can use Google Analytics Debugger.
It‘s a Chrome extension that outputs what happens with your GA tracking to browser console.
Just do the following:
1. Install the extension.
2. Open the target website.
3. Click on its icon in Chrome.
4. Press Ctrl + Shift + J (or Cmd + Option + J if you‘re on Mac).
5. In this console, you‘ll every nitty-gritty detail of what your website sends to GA.
Source: searchengineland.com
6. Your Conversions Are Higher Than You Think
Google Analytics makes your conversion rates looks worse than they really are
Do you ever feel disappointed when looking at your conversion rates in Google Analytics?
I know I do sometimes.
And while there are always millions of things you can improve, your real conversions rates are actual higher than GA tells you.
The thing is, GA shows you conversion rate per session.
And one user can have many sessions.
I don’t know about you, but I care about how many users actually converted in the end.
Not what percentage of sessions resulted in a conversion.
If it took them 10 sessions to convert, I’m totally okay with that.:)
Here is what Avinash Kaushik suggests you do:
- Go to GA Admin – Calculated Metrics;
- Create a metric “Conv Rate Per User”;
- Set formatting type = “Percent”;
- Set Formula = “{{Form Submit – Quote (Goal 3 Completions)}} / {{Users}}”, but with your own goal name;
- Save, and then create a new custom report to show this new metrics, broken out by landing page, source/medium or whatever dimension(s) you care about the most right now.
Source: www.kaushik.net
7. Improve Your Analytics Accuracy by 20% Today
20% of your GA traffic may not really be from your customers (but you can exclude it)
If you’re constantly checking your site, tweaking details, and updating content, a sizable portion (10-30%) of your traffic is from you and your team, not from your customers.
Can you really rely on your Google Analytics data if its skewed by your own and your colleagues’ visits?
Removing internal visits will result in much more accurate reports and better decision-making.
You could set up a filter in GA to exclude your visits by IP address, but this method takes time and the filter needs to be updated constantly (when you connect from a different Wi-fi or if you have a dynamic IP address).
Instead, you can install this Chrome extension that will block Google Analytics for your browser, and ask your colleagues to do the same.
This will remove all internal page views and make your analytics much more accurate.
8. Make your GA Content Experiments 2X faster
Make your website 2X faster by removing the redirect in your Google Analytics Content Experiments
Before I reveal today’s insight…, can you please reply to this email and answer this short question: What’s the #1 biggest marketing challenge you’re struggling with right now? Your answer will help me deliver more relevant content.
Do you use Google Analytics Content Experiments, but hate those redirects it produces?
Split-testing is crucial, but it comes at a cost of bad user experience in the short term.
GA Content Experiments can slow down your pages by up to two times, because they force the website to be loaded twice.
This is really bad, but switching to a different split-testing engine is painful.
Would you like to keep using GA Content Experiments the same way you’re doing it now, but without the redirects?
To speed up your website and decrease the bounce rate caused by it?
Now it is possible!
In fact, the only reason that Experiments reload the pages is because they are implemented on the client side, using JavaScript.
This framework will allow your developer to move the Experiments engine to the back-end (where it can run in a fraction of a second).
9. Get 10X More Data About Your Users
Start tracking these 11 micro-conversions in under three minutes
You’re probably tracking how many people submit a form on your website.
But chances are, you don’t know what else they do on your website.
Usually only a small percentage of users convert.
Which leaves you flying blind when it comes to most of your users.
You don’t know if they clicked on:
- the video and if they finished watching it;
- the file download;
- your email or phone number;
- any outbound links;
- your social media share buttons;
if they scrolled to the end.
Which really sucks!
Thankfully there is solution that allows to start tracking all those things above in under 3 minutes:
1. Put this script on your website:
<script src=”//datamart.github.io/
</script>
2. Open GA – Real-Time – Events – Events (Last 30 min).
3. Start doing stuff on your website (e.g. download files, watch videos etc) and notice new events pop up in GA.
4. Configure goals for your most important events. Use Behavior – Events – Overview to look up event labels.
10. Demystify up to 50% of Your Direct Traffic
Do you know that up to 50% of your direct traffic is actually just visitors that GA couldn’t identify?
Before I reveal today’s insight…, can you please reply to this email and answer this short question: What’s the #1 biggest marketing challenge you’re struggling with right now? Your answer will help me deliver more relevant content.
When you look at your Source/medium report in Google Analytics, you probably see that a lot of your visitors come from (direct)/(none).
Have you ever wondered that this data might be false?
And that you’re relying on false data when making marketing decisions?
The reality is, in many cases Google Analytics just couldn’t identify these visits, and therefore marked them as direct.
Here is how you can help Google Analytics identify more of your direct traffic:
- Buy an SSL certificate and move your website from HTTP to HTTPS (if you haven’t already). The thing is, Google Analytics cannot identify most of the visits coming from HTTPS sites, if your site is HTTP;
- Add UTM parameters wherever you can. You can use Campaign URL Builder to simplify this process;
- Implement the User ID feature if your users log in on your website. This allows to unify their sessions coming from different browsers and devices (which would otherwise be counted as separate users).
11. Are You Betting on the Wrong Traffic Sources?
You may be really underestimating (or overestimating) the true impact of these marketing channels
As you may know, by default, Google Analytics only gives credit to the very last traffic source before the conversion (last-click attribution).
But often times, users don’t convert right after coming to your website.
Example:
After clicking your Adwords ad, they might google your company name.
And then finally convert after clicking on your remarketing ad on Facebook.
In this case, three channels are involved (Adwords, Organic, Facebook).
But Google Analytics will only give credit to the last one.
If you have many users like this, you’ll give too much credit to the wrong channel (in this case, Facebook).
And not enough credit to Adwords.
Even though it was the main reason for your conversions.
Here is how you can find your most under-appreciated channels:
- Go to GA – Conversions > Multi-Channel Funnels > Assisted Conversions;
- Find which channels have the most Assisted conversions;
- These are the channels you might not be giving enough credit to.
12. How Fast Do Your Users Convert?
Uncover how many days does it take your visitors to convert
Do your users convert right away, or do they browse your site for a few days before making a decision?
How many days does it take them to convert?
Knowing this is important, because it allows to better understand the context of how the users land on your site, and optimize it accordingly.
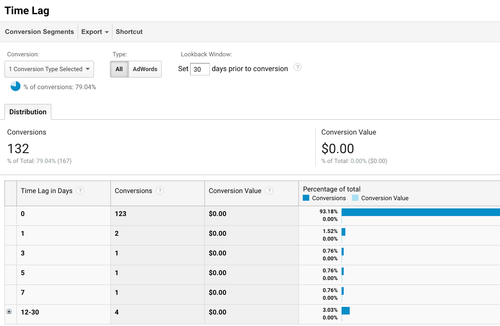
These questions can be answered in a lesser-known Google Analytics report called Time Lag.
Just go to Google Analytics – Conversions > Multi-Channel Funnels > Time Lag, and you will see something like this:
Bonus Tip #13
If you’re like many businesses, your Google Analytics doesn’t integrate offline sales data from your CRM system. This could be causing you to spend a big chunk of your marketing budget on low-quality leads that don’t convert.
You need more than form fills and goal completions to make marketing decisions
It’s not enough to measure form fills, since different traffic sources attract clients of drastically different quality. One channel may generate a handful of high-converting long-term clients, while another may generate nothing but unqualified leads. The only way to evaluate a marketing approach is to track the revenue it generated.
By default, Google Analytics doesn’t track offline revenue
Most sales don’t happen online; they are closed by sales reps, either in person or over the phone. By default, Google Analytics doesn’t have access to these sales, so you have no idea how much revenue was generated by a certain approach, ad, article, or keyword. This results in spending money on leads that don’t buy anything.
The Solution is to integrate your CRM with Google Analytics:
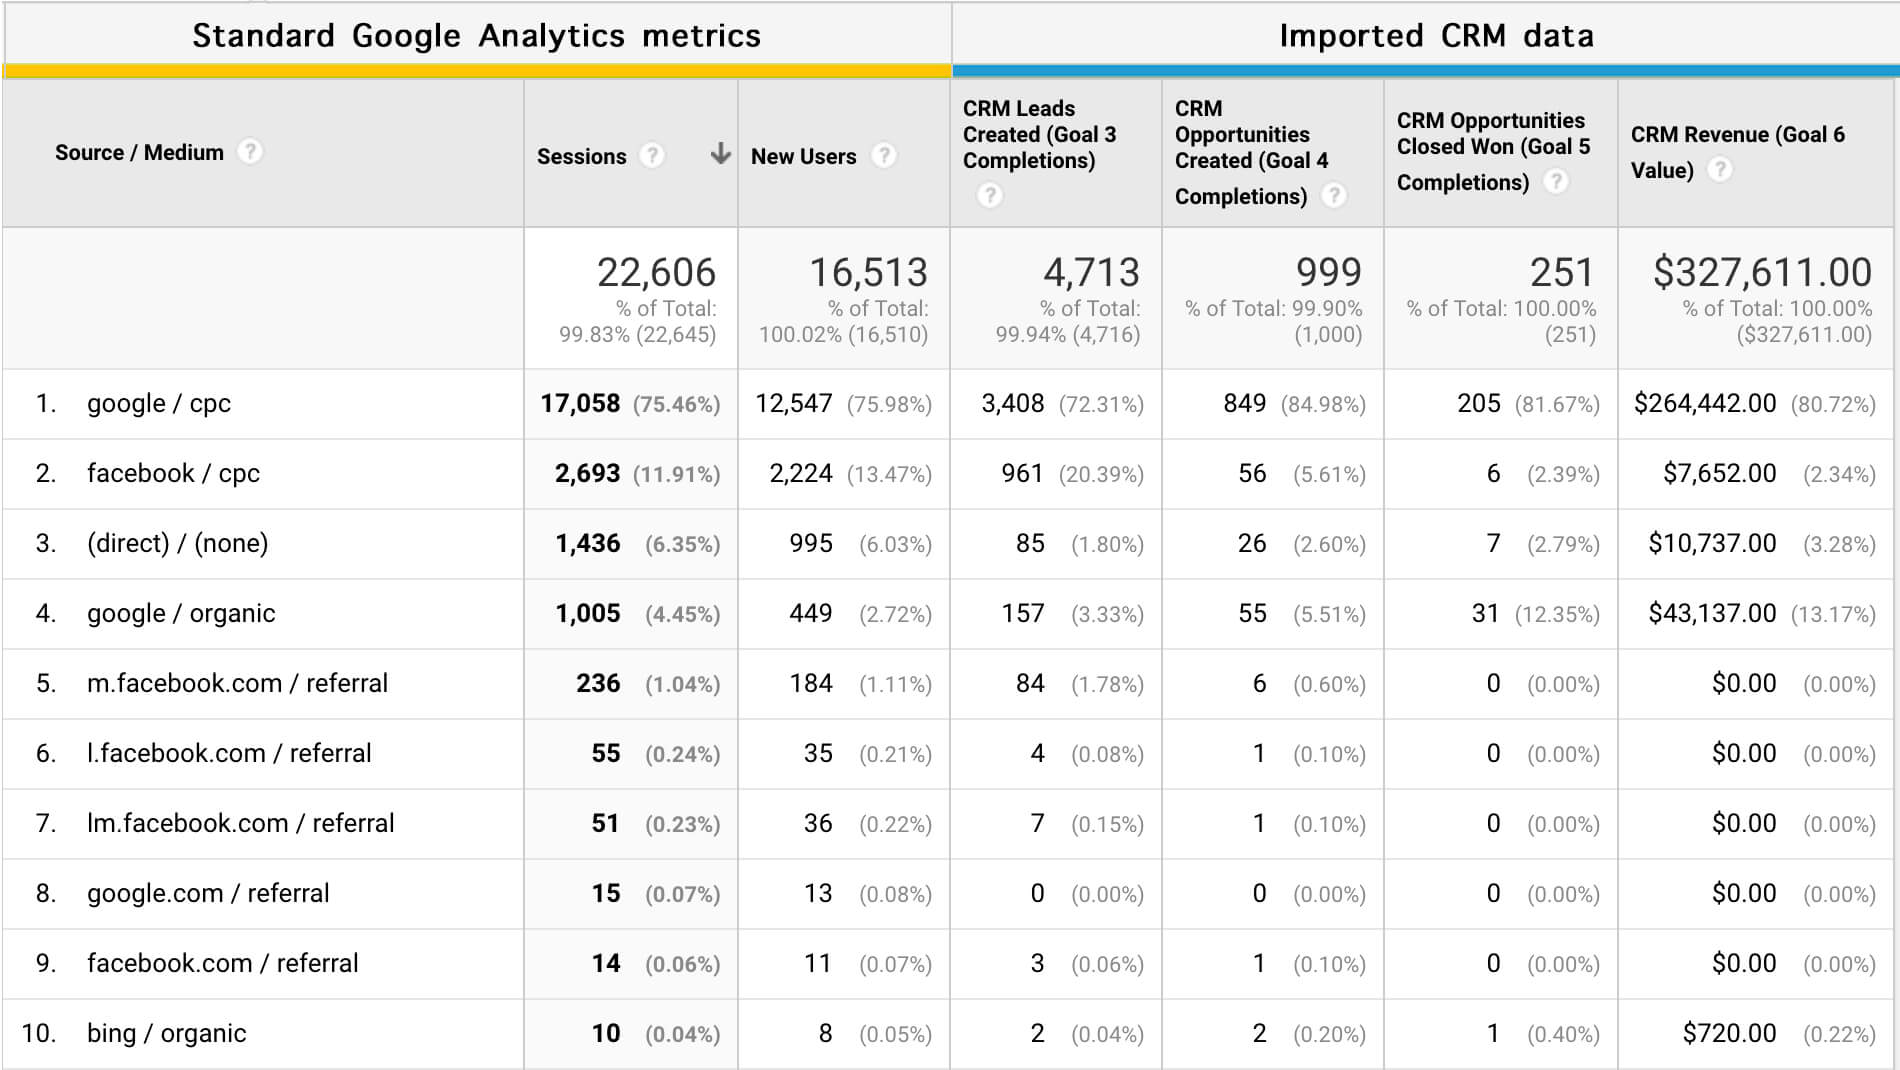
You can do it using our app GA Connector.

Sergii Zuiev is the founder of GA Connector, a marketing attribution platform helping sales and marketing teams track revenue back to the channel, campaign, and keyword level. With a background in PPC and marketing technology, he built GA Connector in 2015 after experiencing firsthand the frustration of not knowing which ads actually drove revenue, and turned that insight into a product now used by hundreds of companies globally.

