Your Complete Marketing Performance Dashboard
GA Connector's Marketing Dashboard gives you a unified view of leads, revenue, and performance across every channel — from paid ads to organic traffic — all in one place.
Currently available for Salesforce customers. Want this for Zoho or Pipedrive? Let us know!
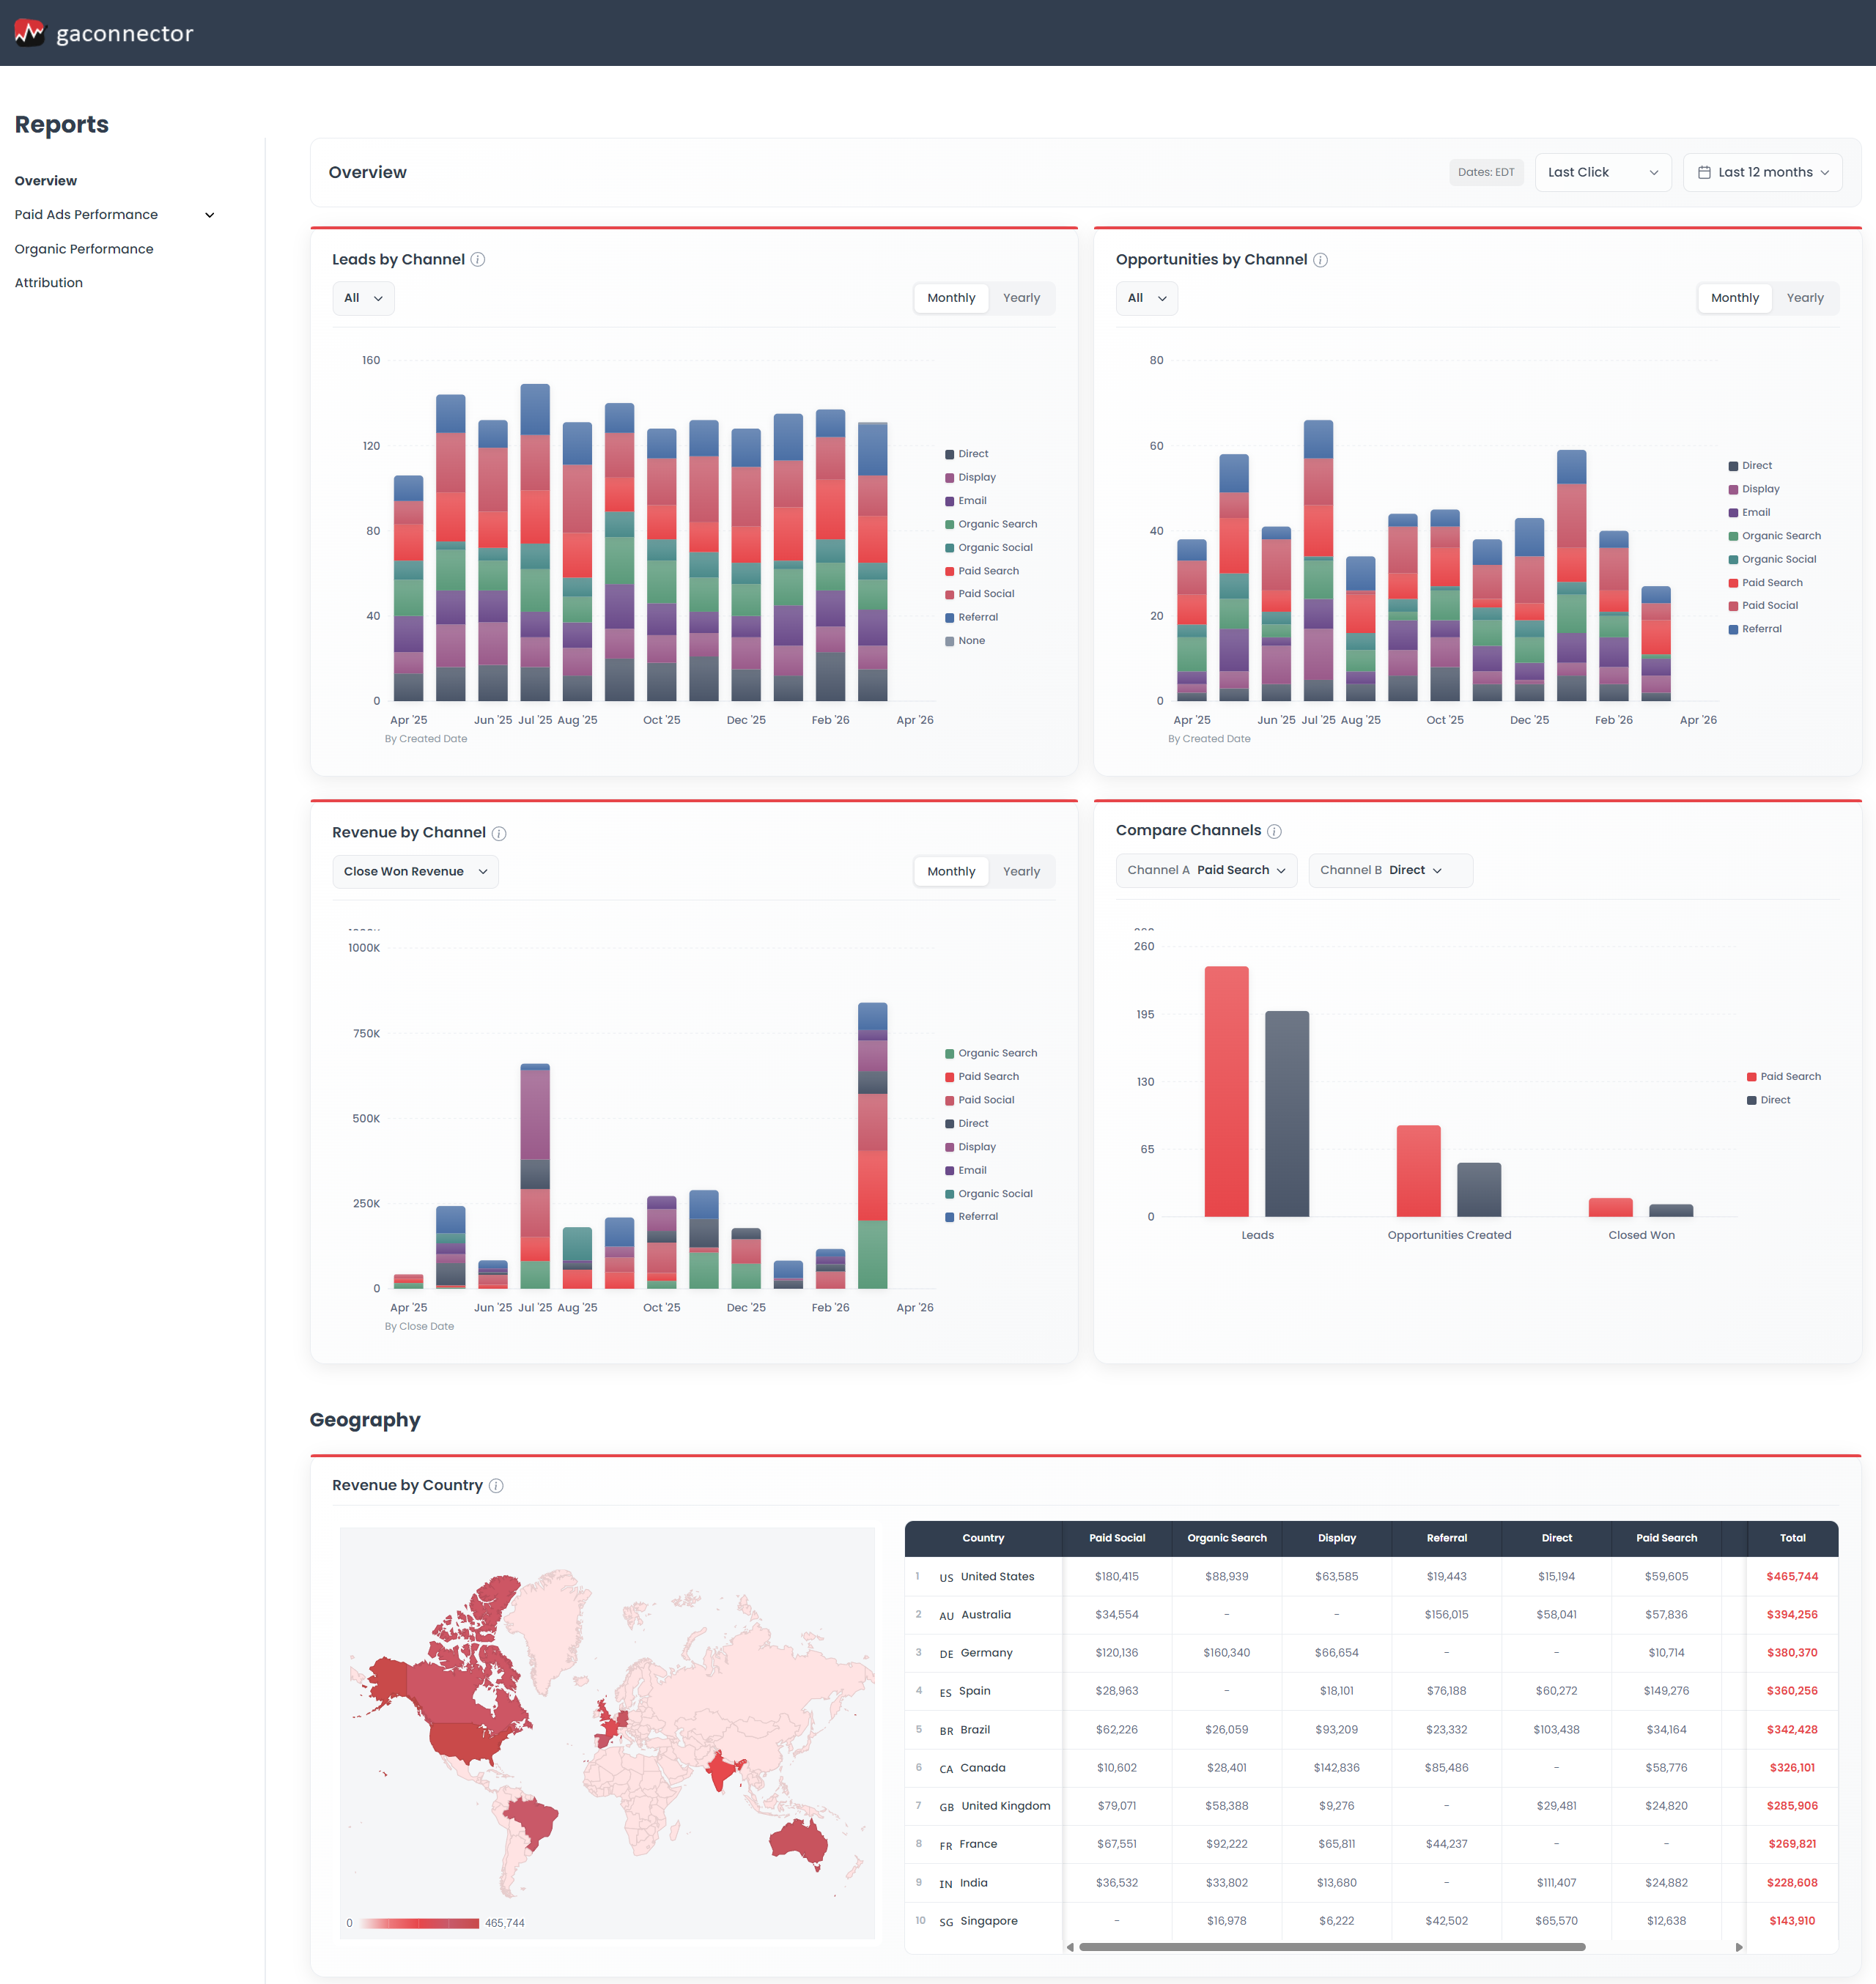
Strategic Performance at a Glance
Get the big picture of your marketing performance. The Overview tab surfaces high-level metrics across all channels so you can quickly assess what's driving leads, opportunities, and revenue.
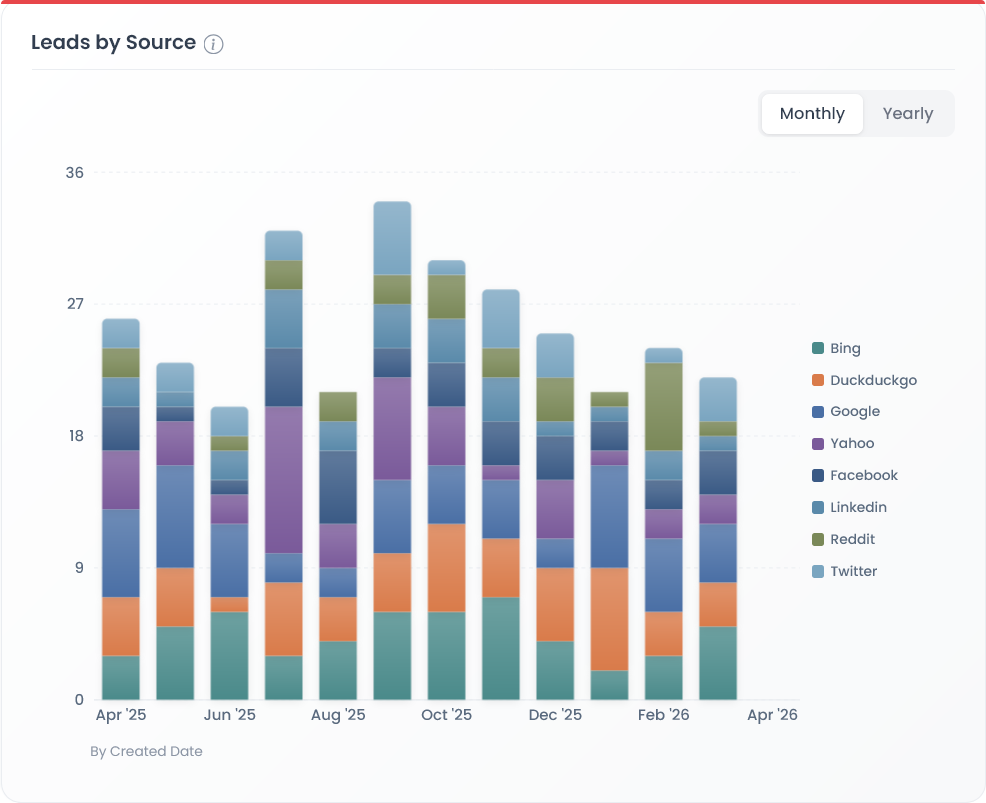
Channel Performance Breakdown
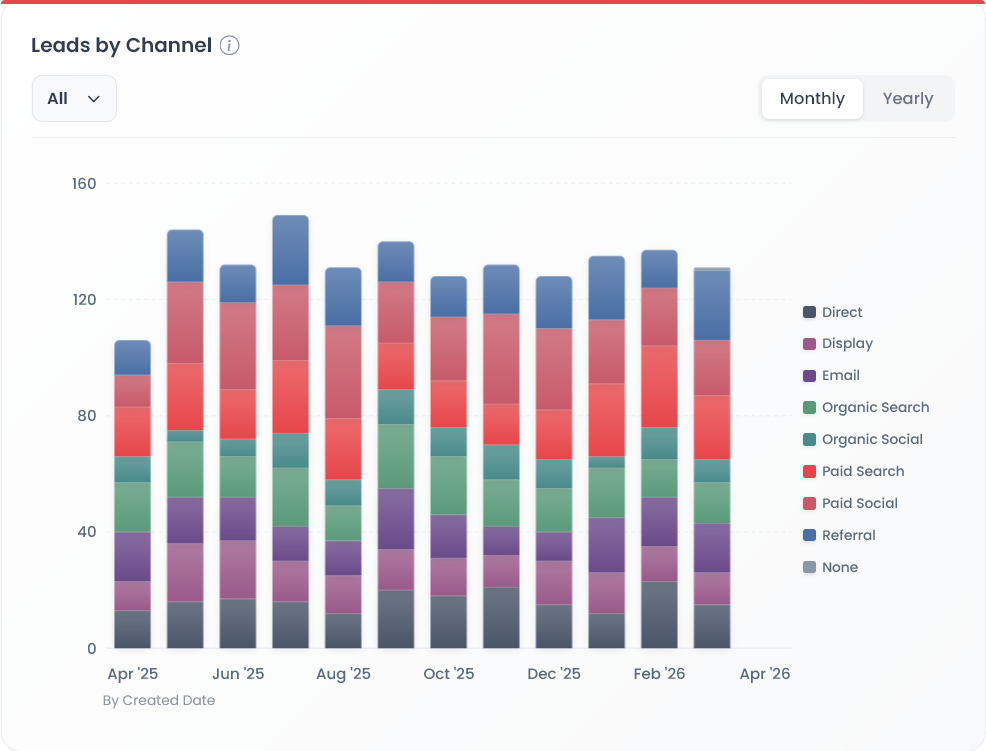
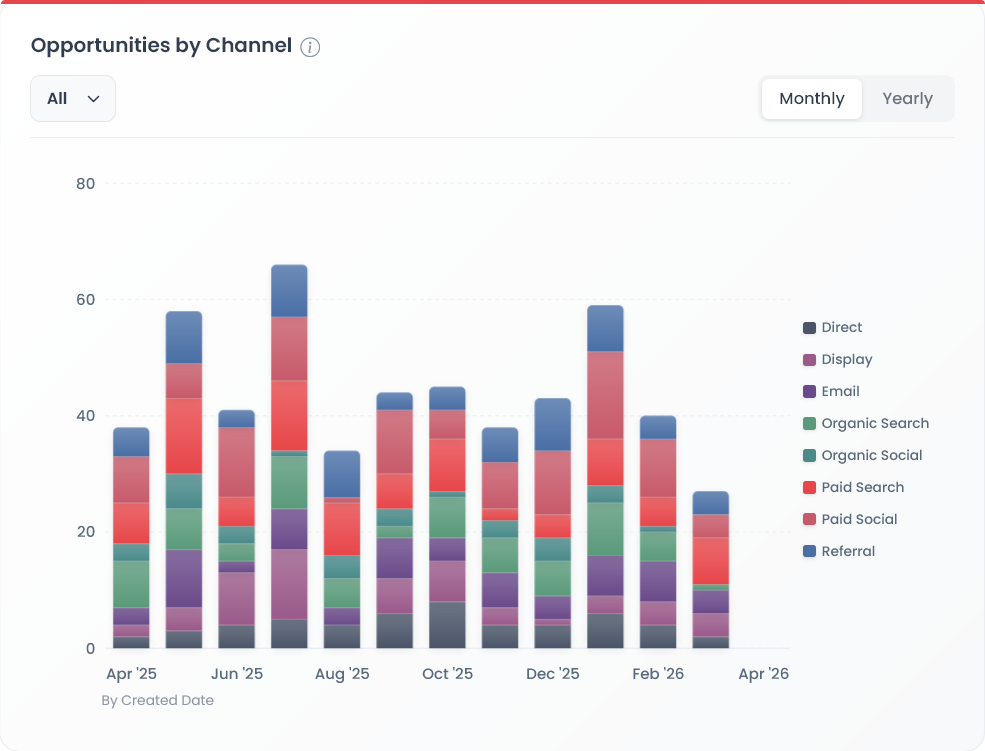
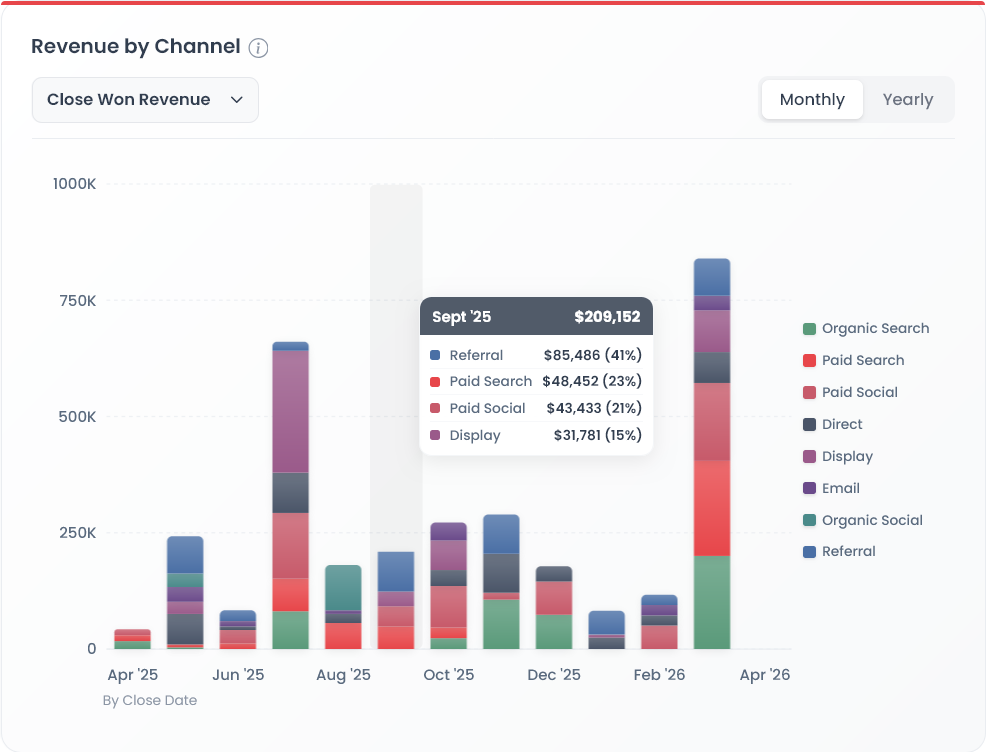
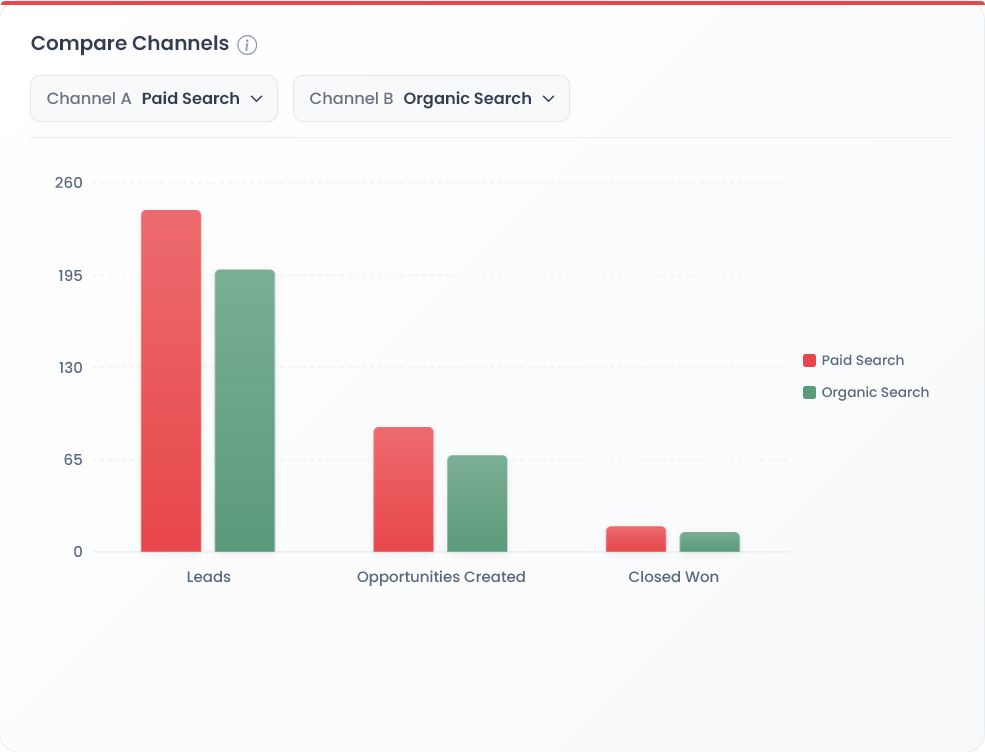
See leads, opportunities, and revenue broken down by marketing channel in one consolidated view. Instantly spot which channels are driving the most value and where to focus your efforts.
- Leads by channel
- Opportunities by channel
- Revenue by channel
- Channel comparison
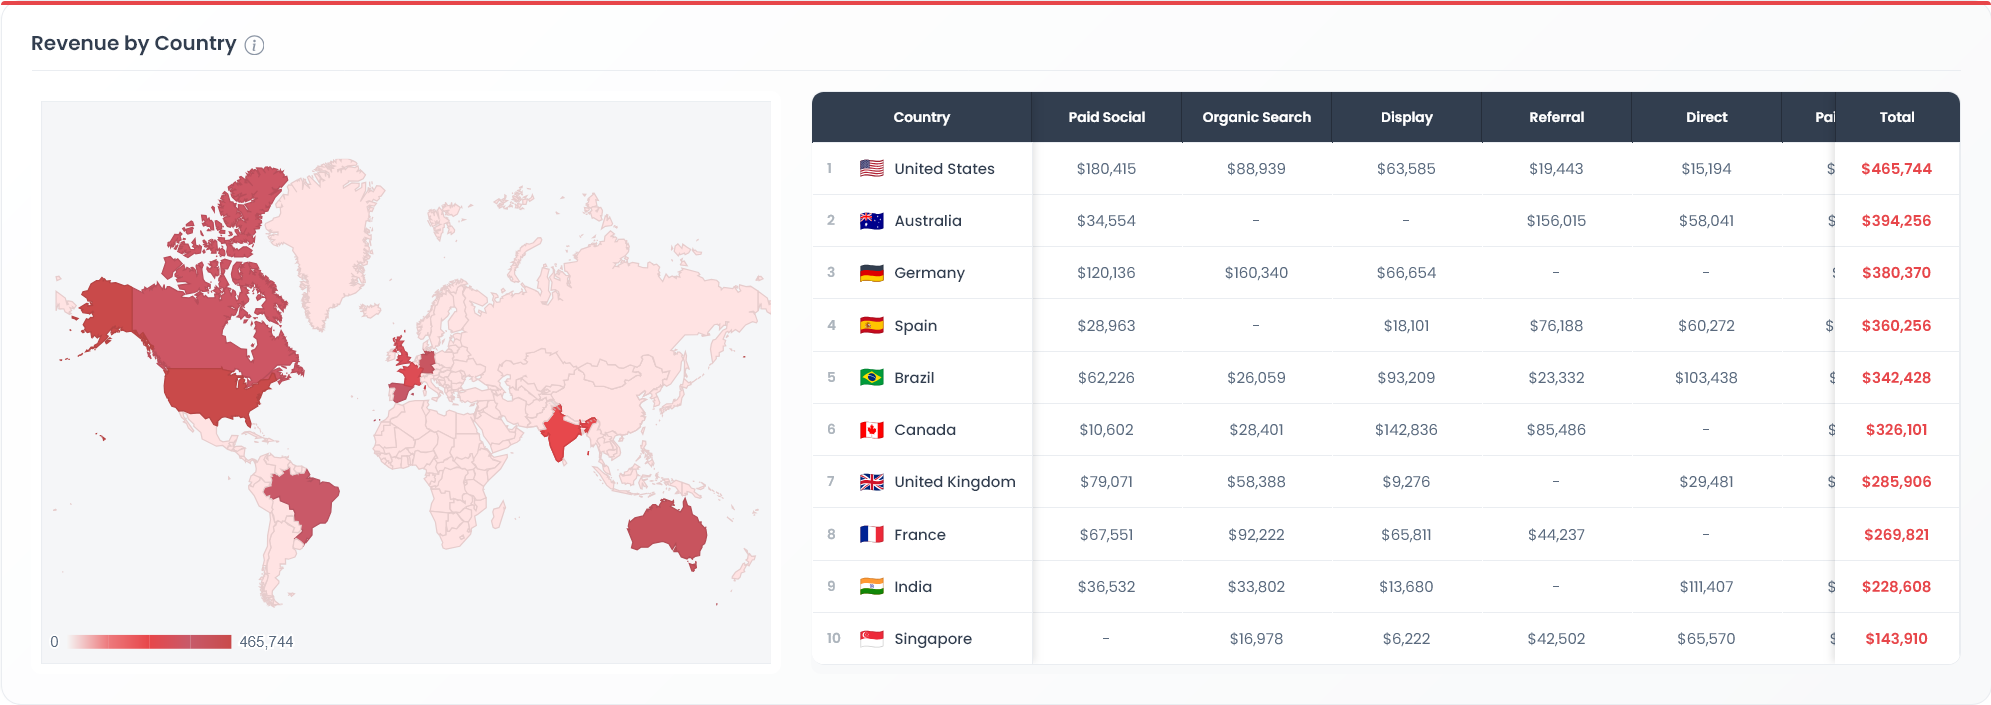
- Revenue by country
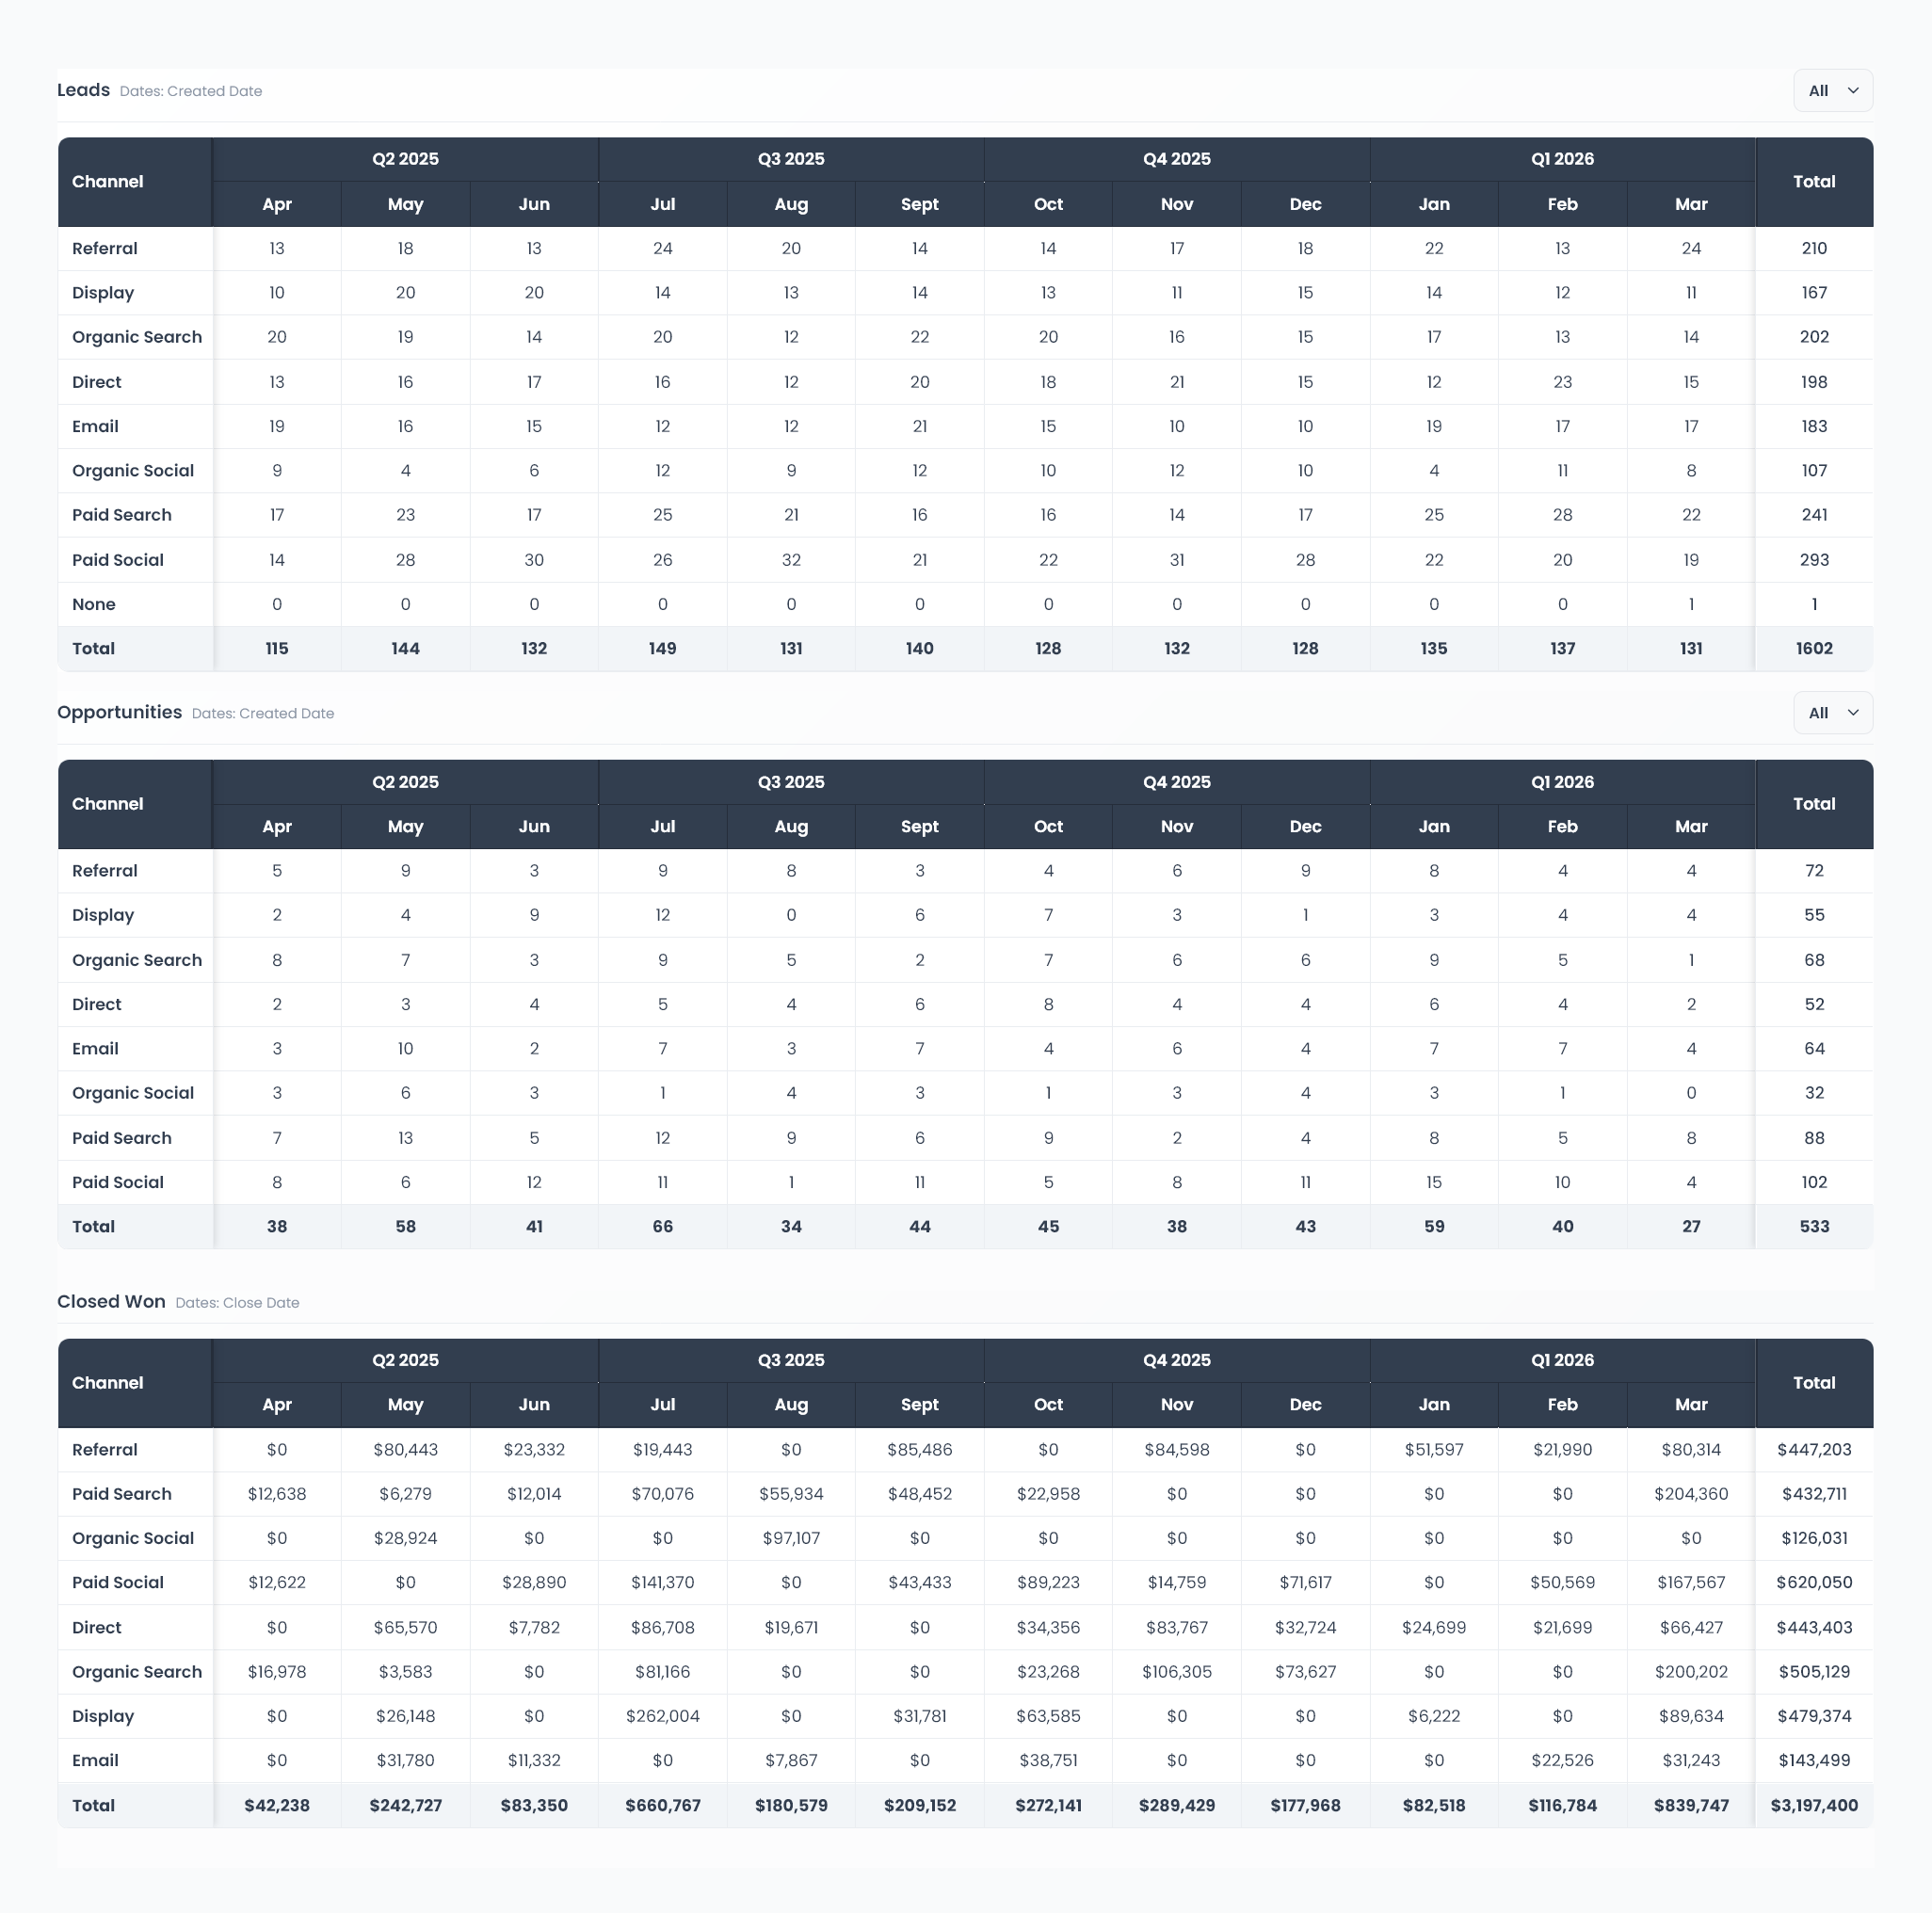
Quarterly Funnel Report
Get a consistent, long-term view of your lead-to-revenue pipeline. The Quarterly Funnel Report always shows the last four completed quarters — giving you a reliable benchmark to track how well your marketing converts leads all the way through to closed-won revenue.
Drill Deep Into Your Paid Channels
Analyze every paid traffic source with granular detail — from high-level source comparisons to campaign, ad group, and keyword-level breakdowns across Google Ads, Meta Ads, LinkedIn Ads, Bing Ads, TikTok Ads, and more.
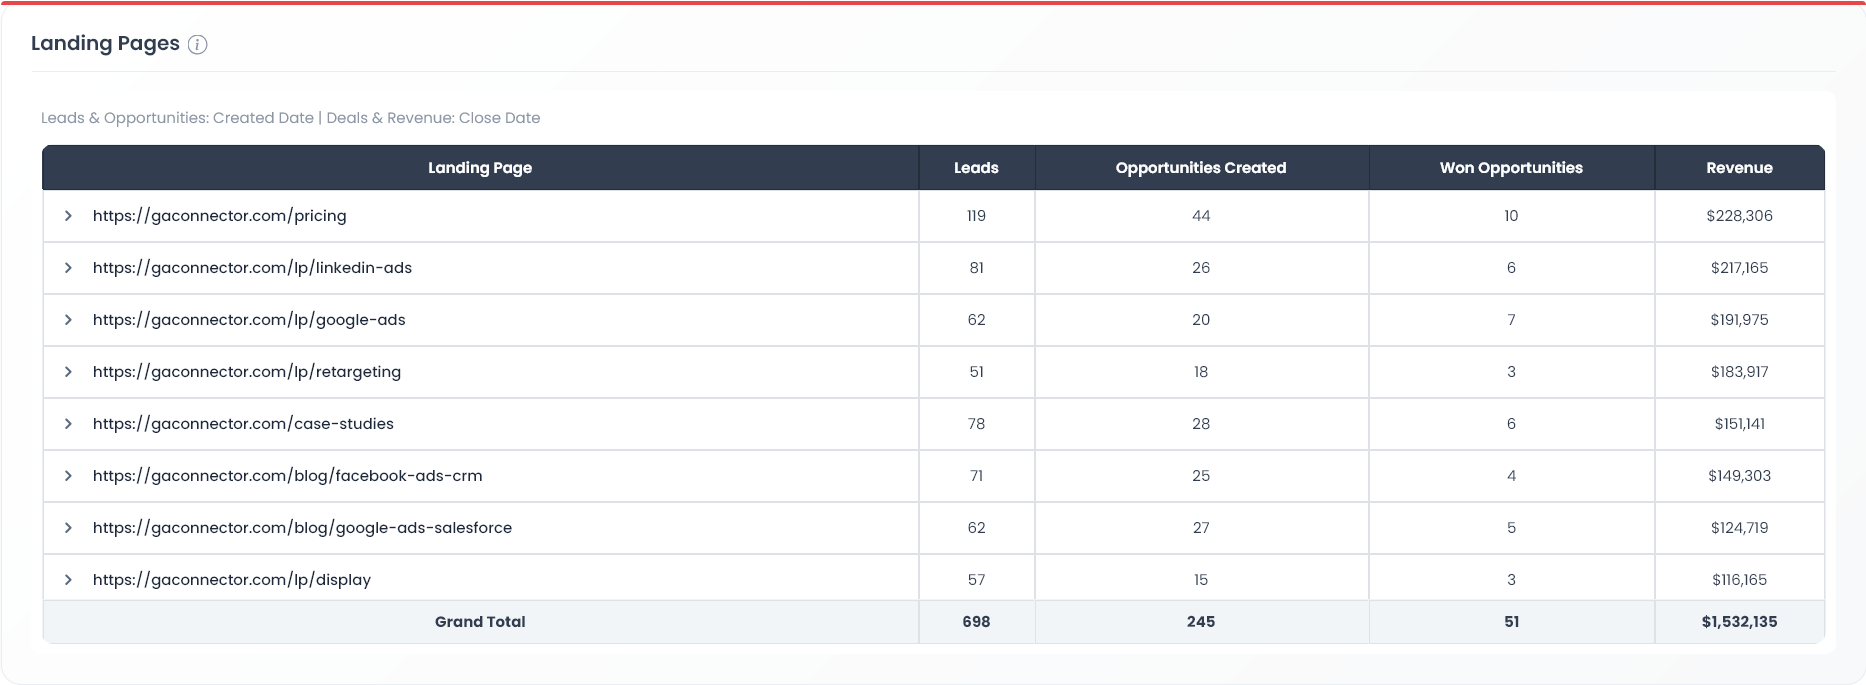
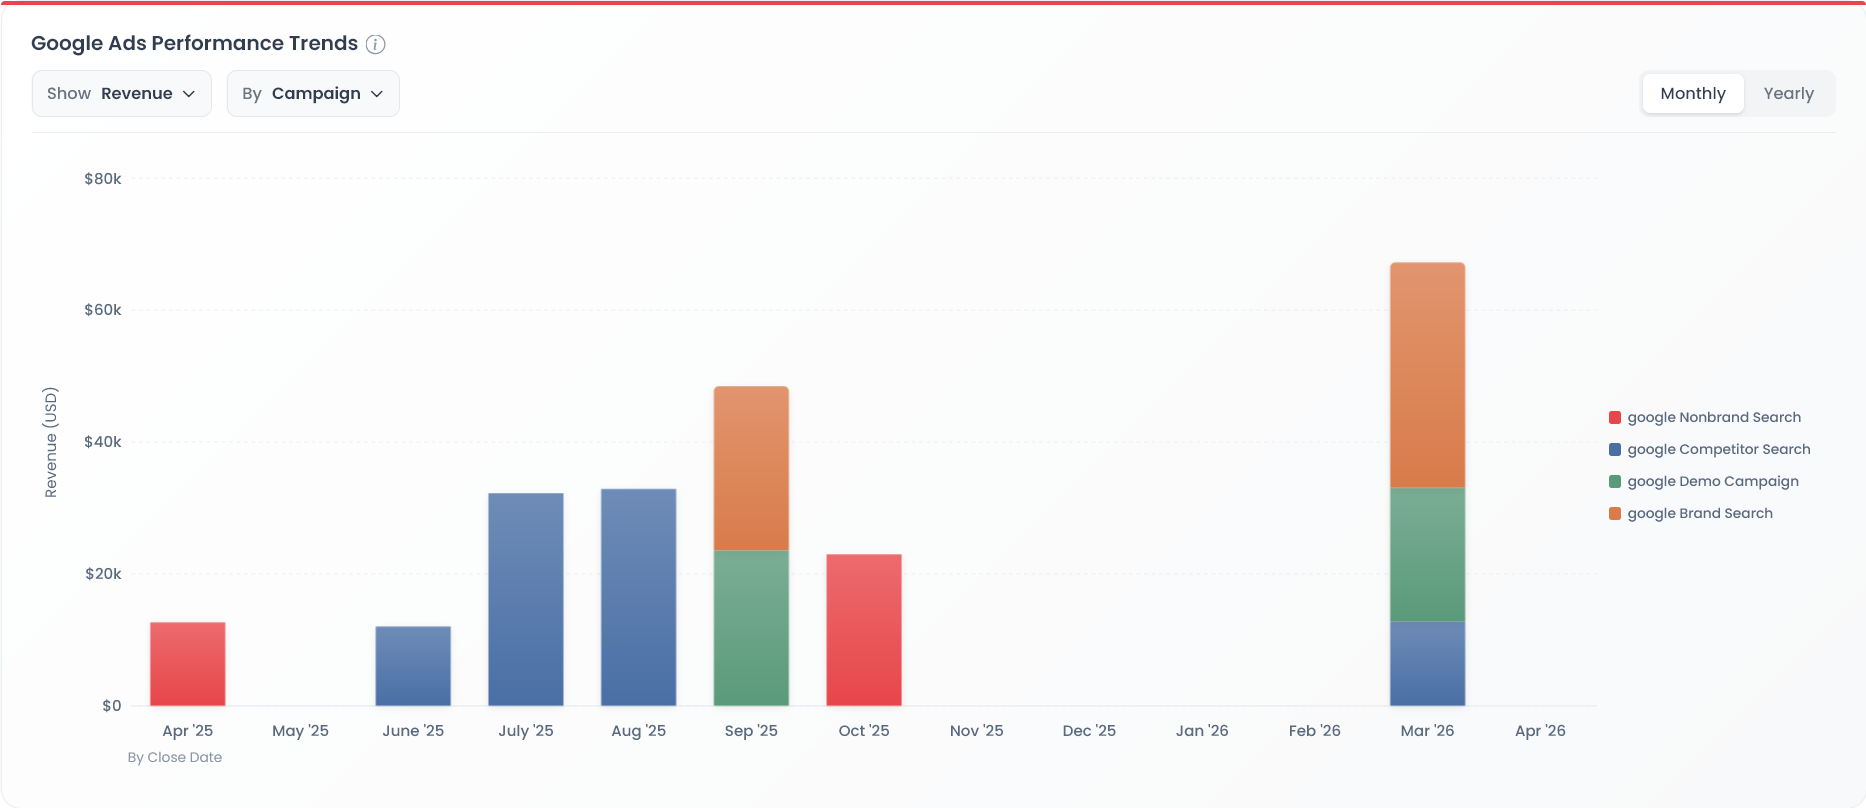
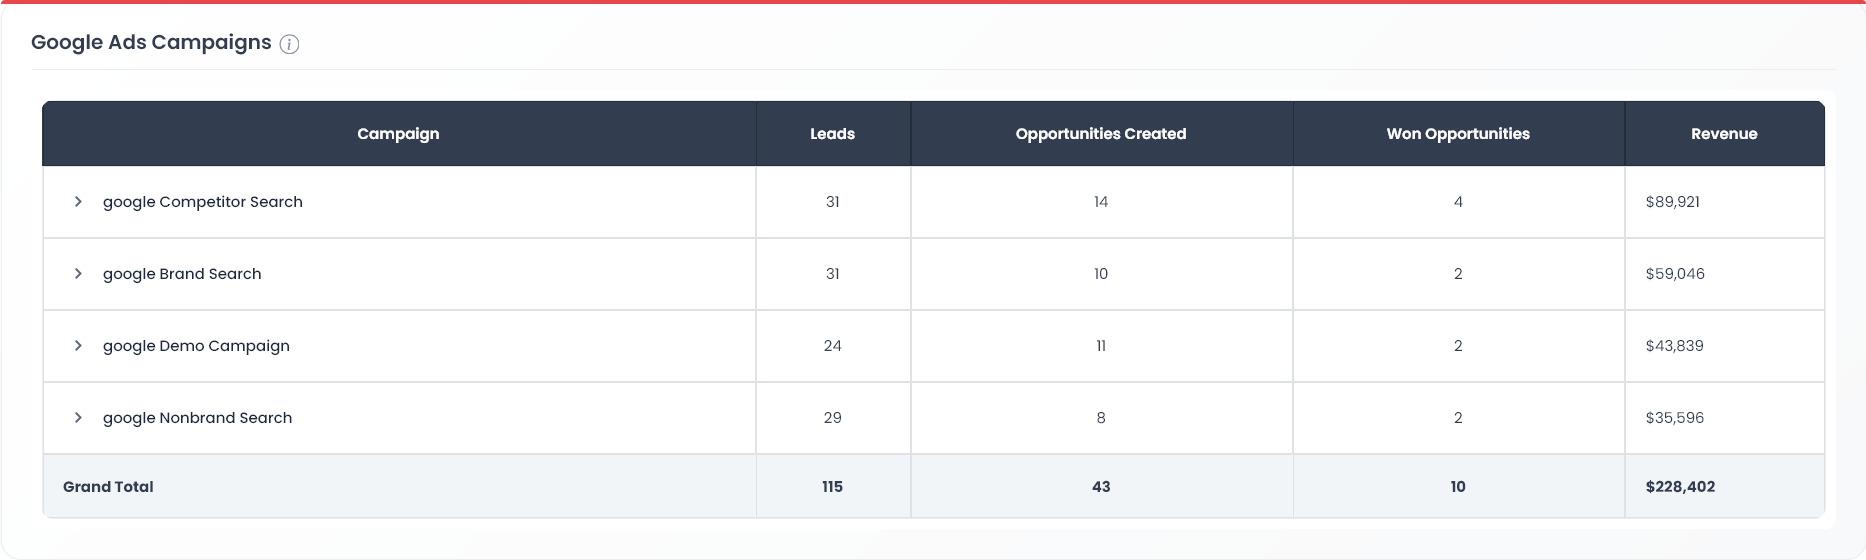
From Source Overview to Keyword Detail
Compare leads and revenue across all paid sources, drill into landing page performance, then go platform-by-platform — campaign, ad group, and keyword — across all major ad platforms.
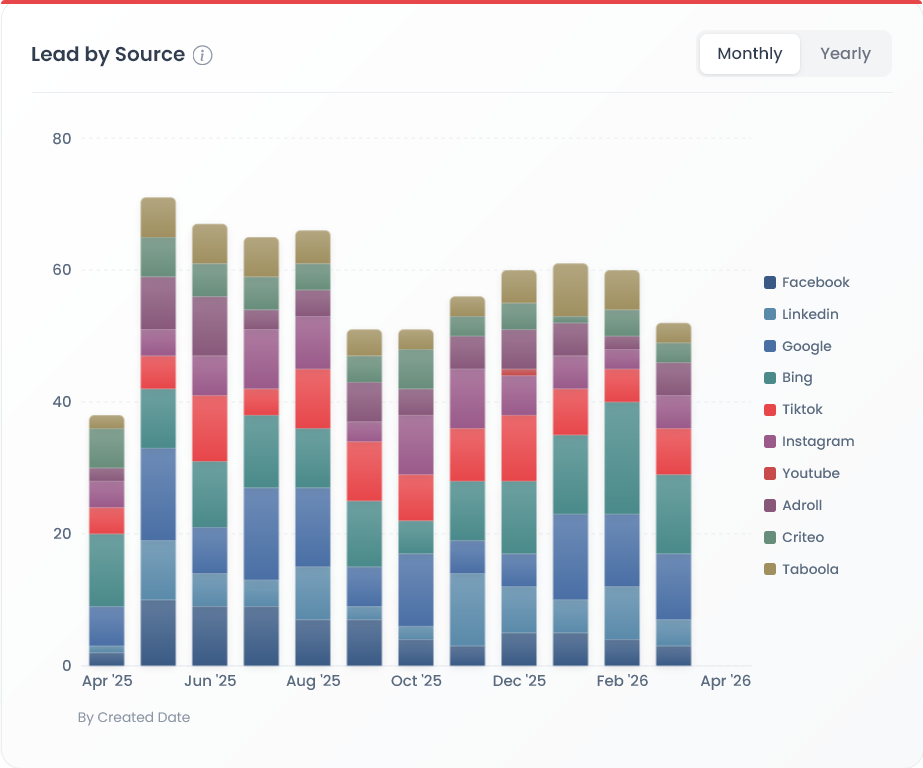
- Leads by paid source
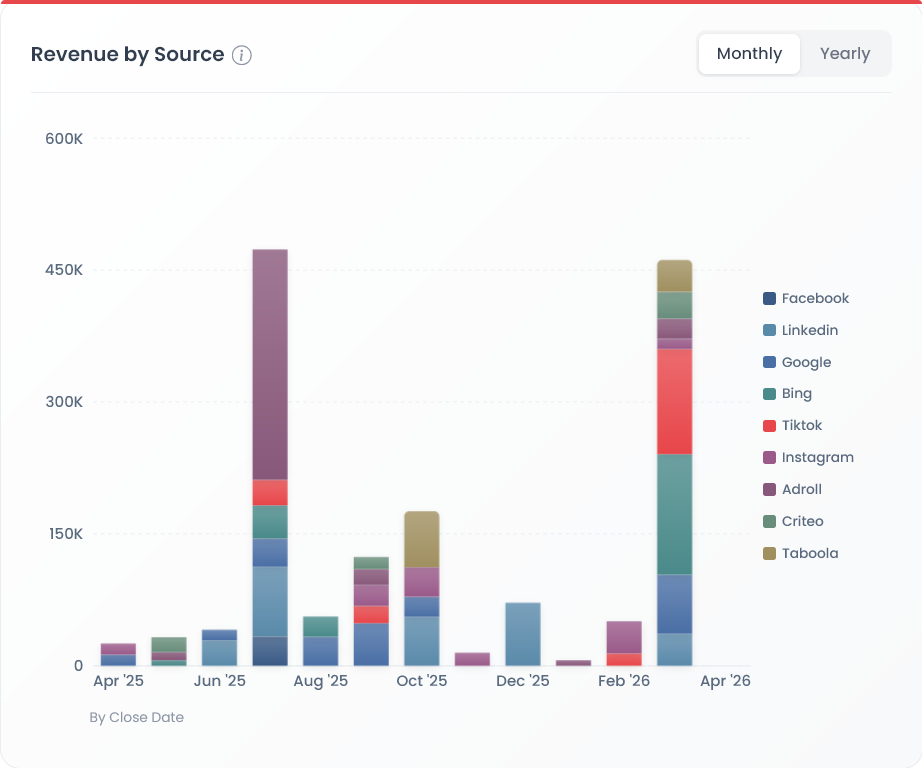
- Revenue by paid source
- Landing page performance
- Campaign & ad group breakdown
- Keyword-level analysis
Understand Your Organic Traffic ROI
Go beyond traffic numbers. See which organic sources — search, social, referral, and direct — are actually generating leads and revenue for your business.
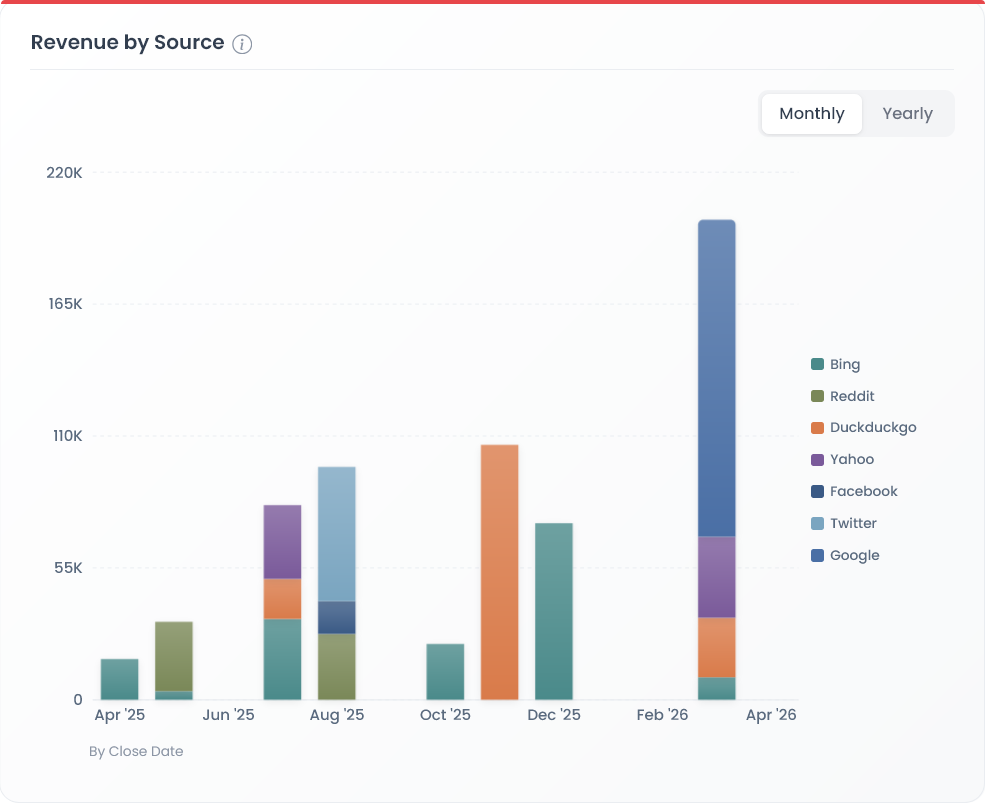
Organic Channels, the Same Depth as Paid
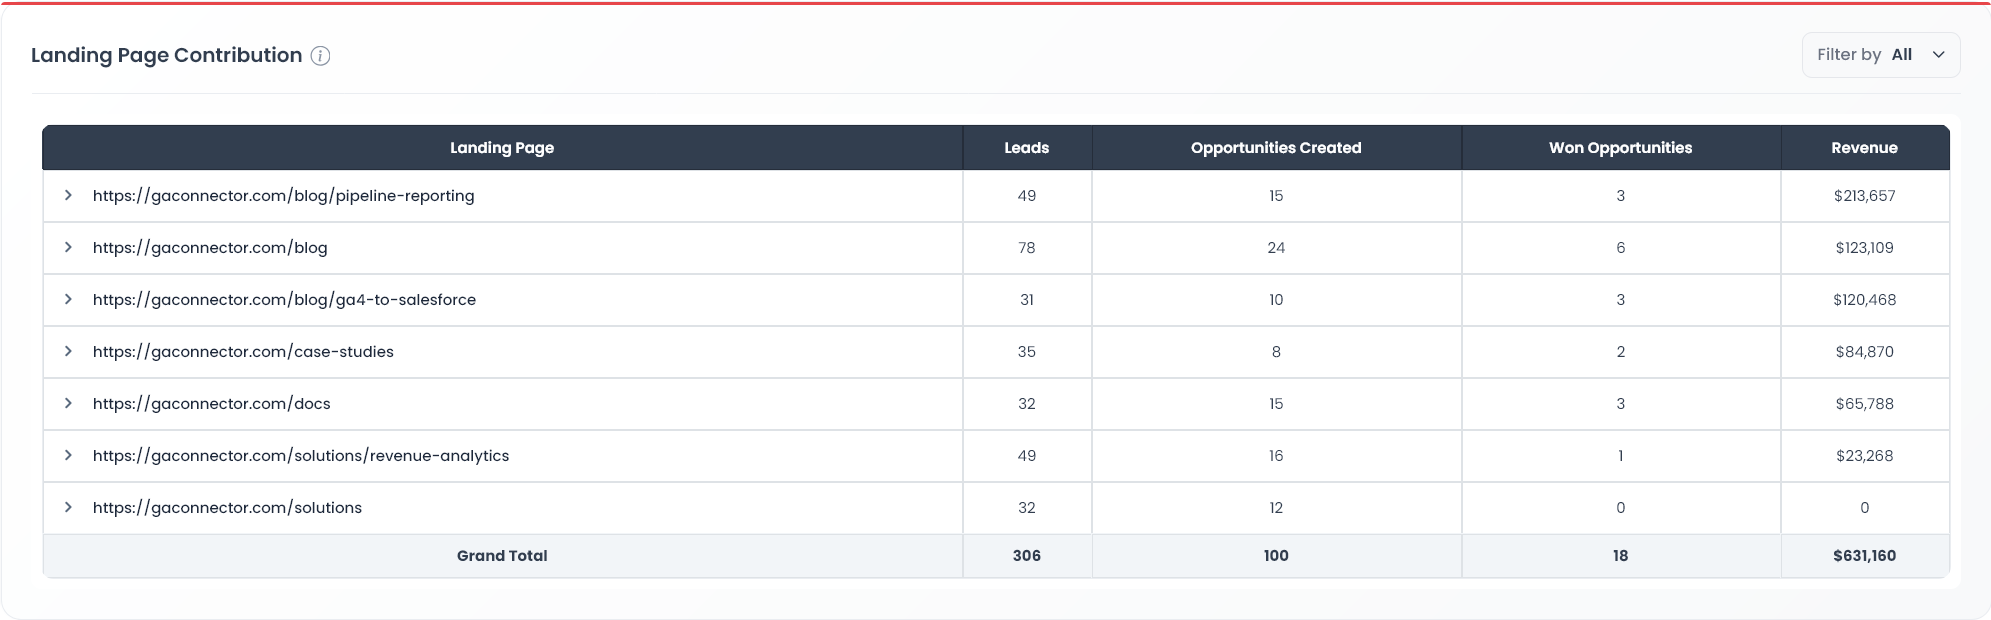
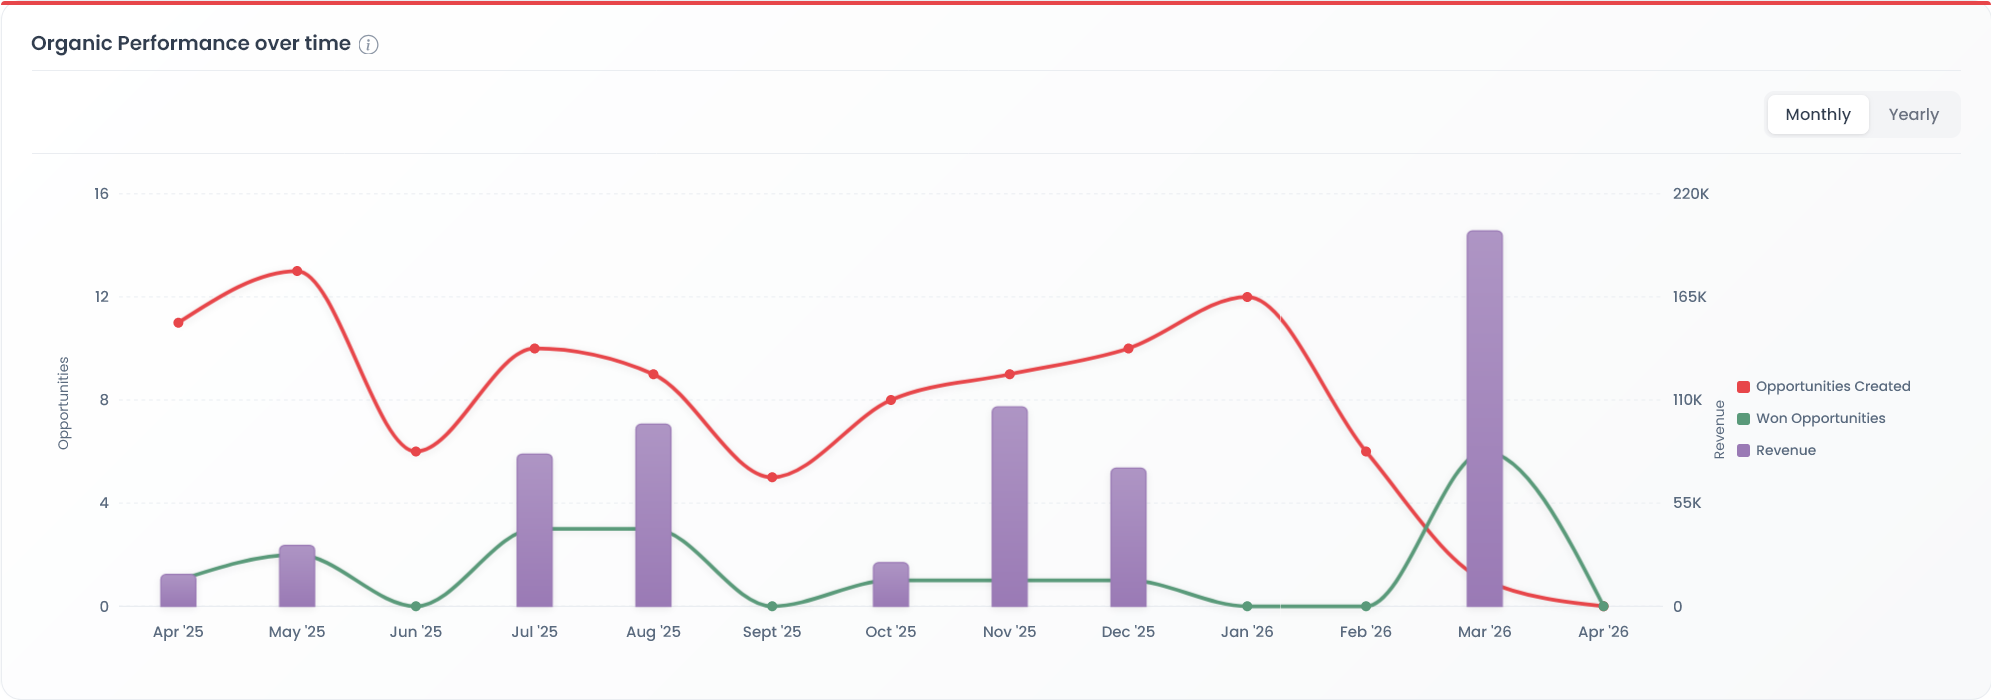
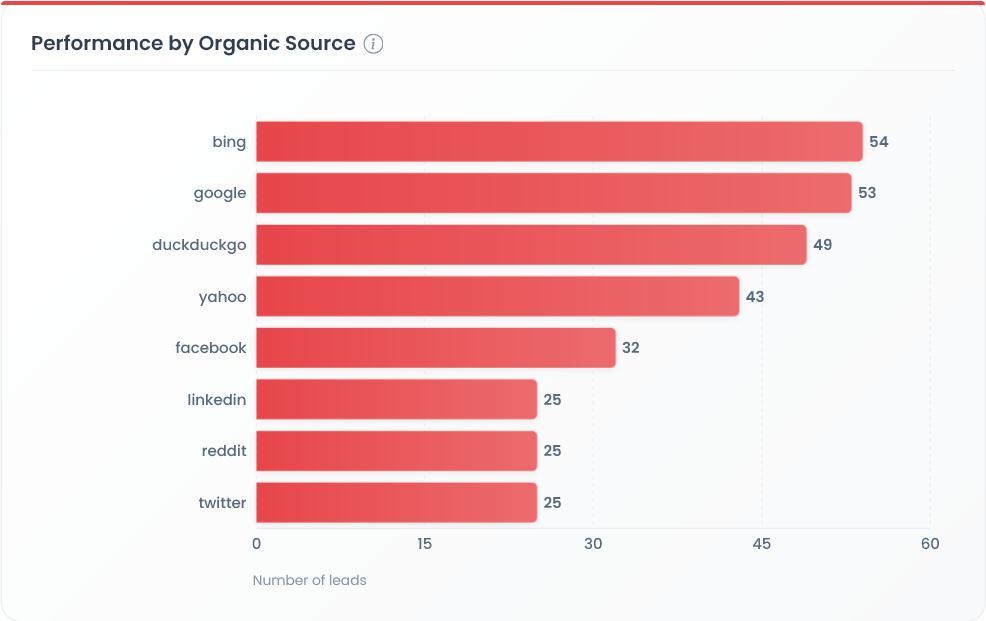
Track leads and revenue from organic channels with the same granularity as paid. Identify your top-performing sources, see which landing pages convert, and monitor trends to measure the impact of your content strategy.
- Leads by organic source
- Revenue by organic source
- Organic landing page performance
- Performance trends over time
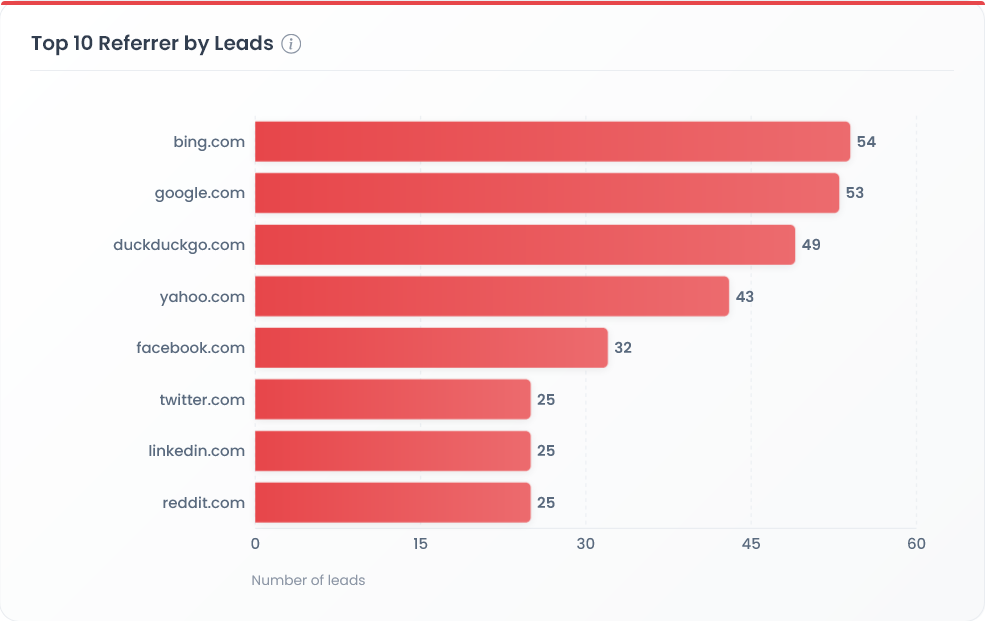
- Top 10 organic sources by leads
- Top 10 referrer by leads
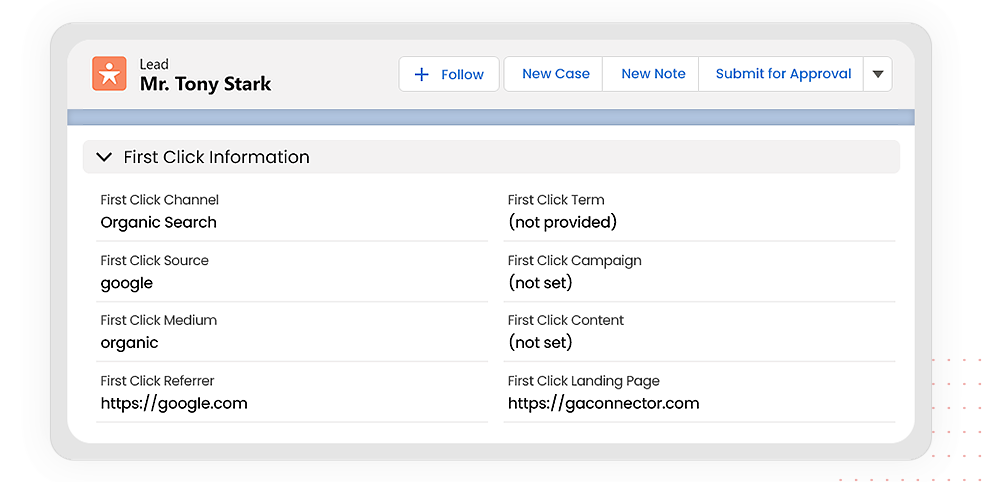
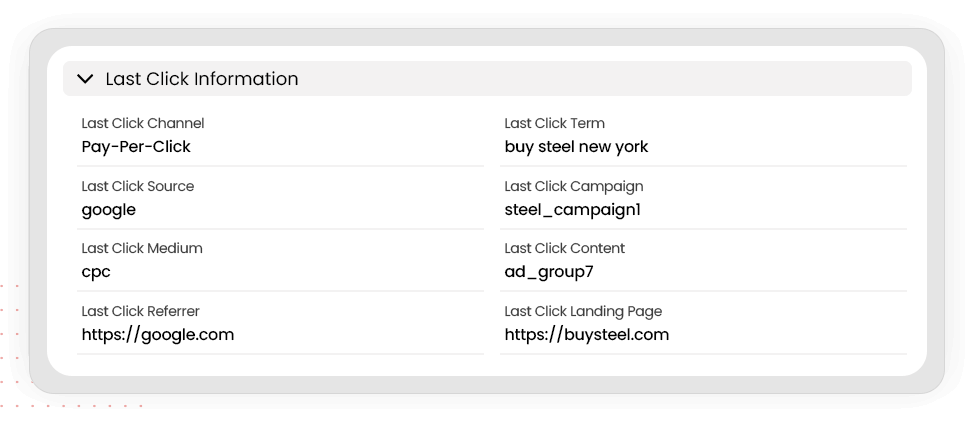
First Click vs. Last Click Attribution
Understand the full customer journey. Compare how different attribution models value your channels and discover which touchpoints are truly responsible for driving revenue.
Two Models, One Clear Picture
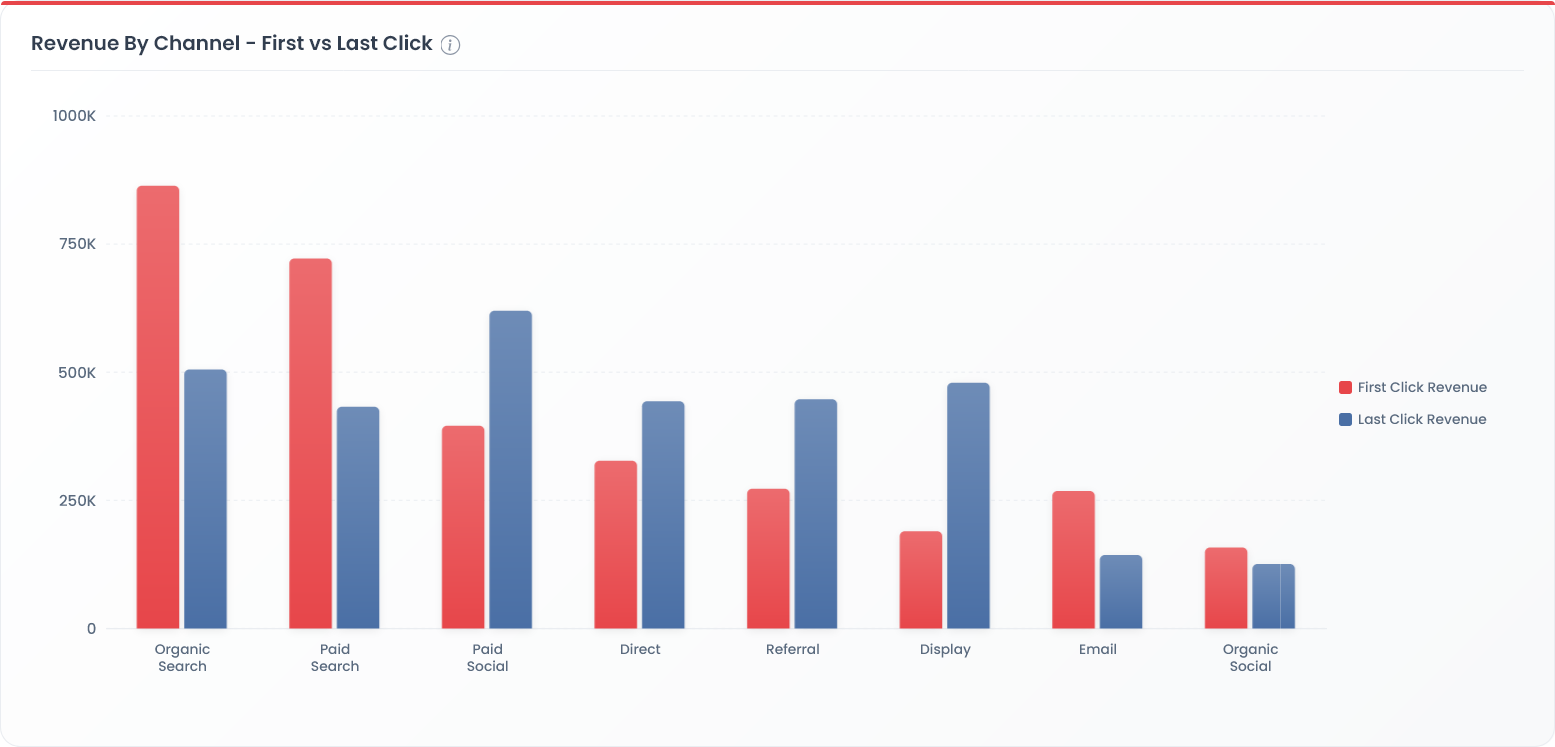
Compare First Click and Last Click attribution side by side. See how revenue attribution shifts between channels depending on which touchpoint you credit — so you can invest in the channels that start the journey, not just close it.
- Revenue by channel — First vs. Last Click
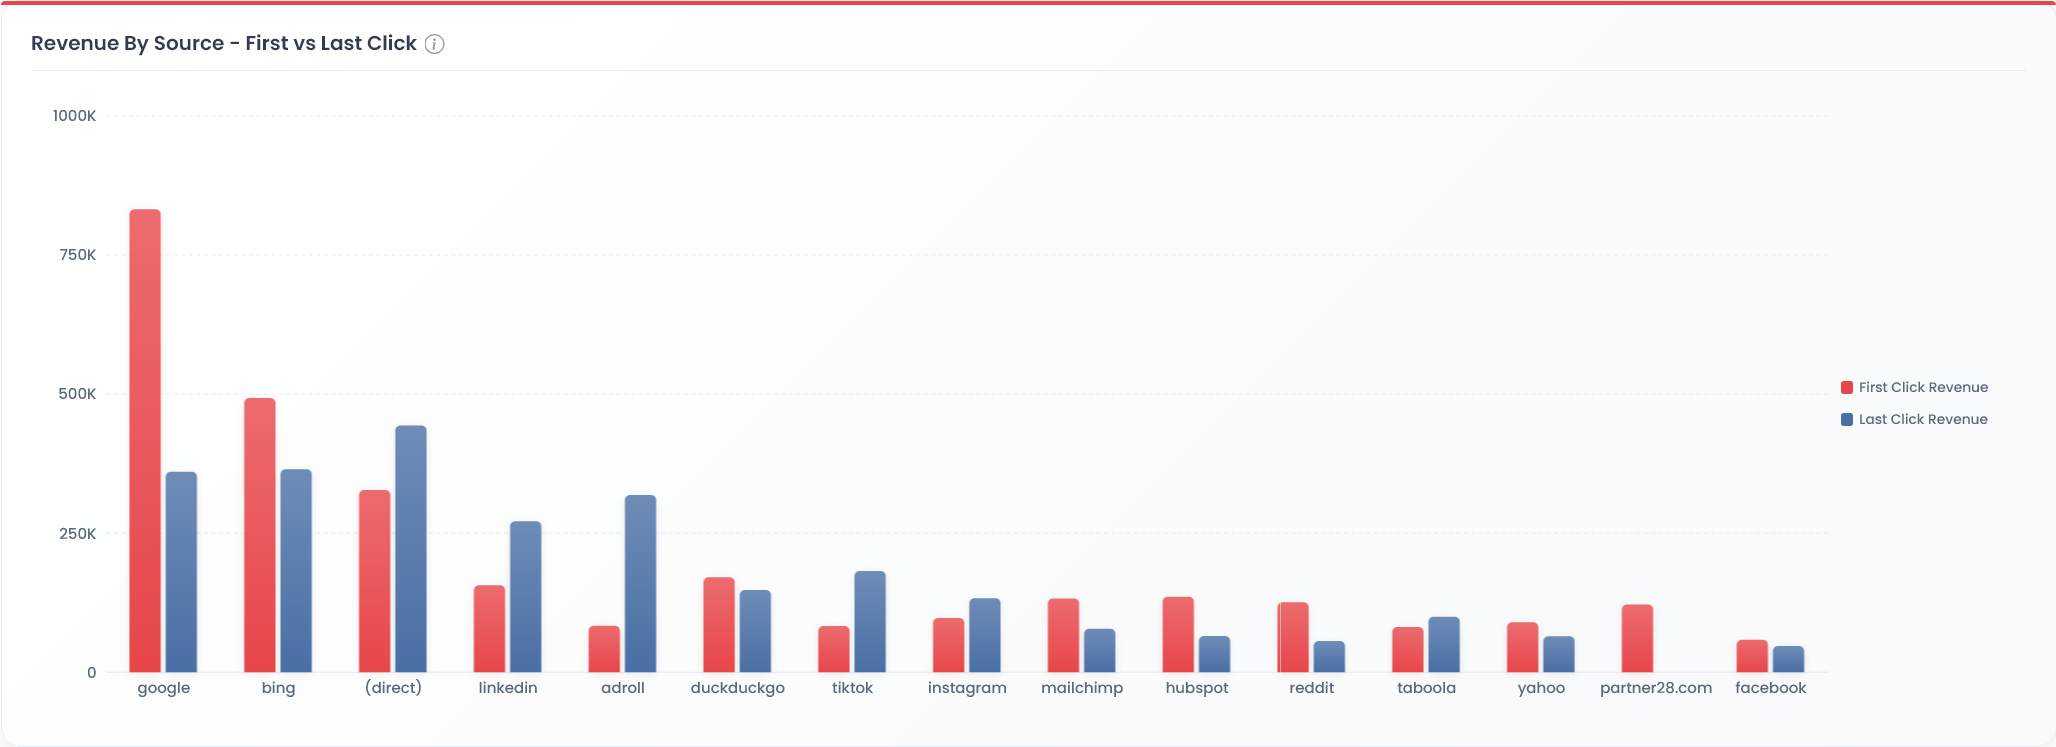
- Revenue by source comparison
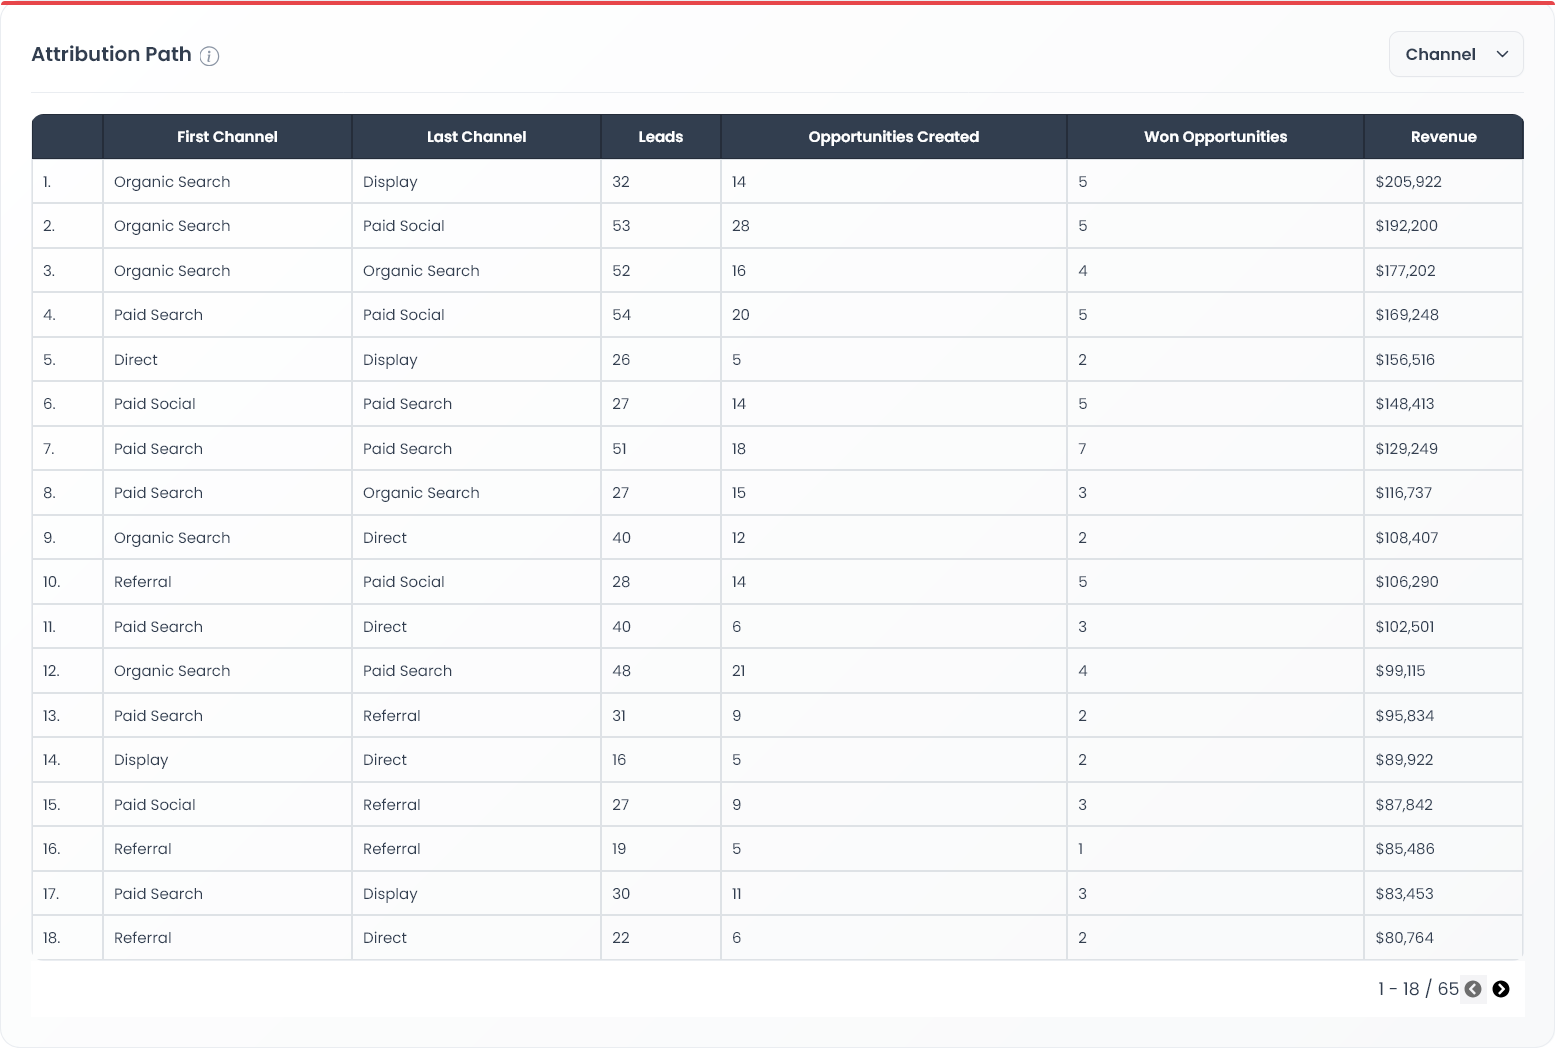
- Attribution path analysis
See Your Full Marketing Picture
Connect Salesforce with Google Analytics and unlock the Marketing Dashboard today.
Start a Free Trial Now